Categories in Tegel
Tegel Facts
| Area | 33.1 km² |
| Population | 57,360 |
| Male Population | 27,904 (48.6%) |
| Female Population | 29,456 (51.4%) |
| Population change (1975 to 2020) | +9.5% |
| Population change (2000 to 2020) | +1.3% |
| Median Age | 43 years (Male: 42, Female: 44) |
| Neighborhoods | Tegel, Frohnau, Dorotheenstadt |
| Local Time | |
| Timezone | Central European Summer Time |
| Lat & Lng | 52.57601, 13.29389 |
| Postal Codes | 13405, 13505, 13507, 13509 |
Map of Tegel
Interactive Map
Tegel Population
Years 1975 to 2020
| Data | 1975 | 1990 | 2000 | 2015 | 2020 |
|---|---|---|---|---|---|
| Population | 52,383 | 53,523 | 56,611 | 56,392 | 57,360 |
| Population Density | 1,581.4 / km² | 1,615.8 / km² | 1,709 / km² | 1,702.4 / km² | 1,731.6 / km² |
Sources: JRC (European Commission's Joint Research Centre) work on the GHS built-up grid
Tegel Population change from 2000 to 2015
Decrease of 0.4% from year 2000 to 2015
| Location | Change since 1975 | Change since 1990 | Change since 2000 |
|---|---|---|---|
| Tegel | +7.7% | +5.4% | -0.4% |
| Berlin | +8% | +4.8% | -0.3% |
| Germany | +2.6% | +2.2% | -1.5% |
Sources: JRC (European Commission's Joint Research Centre) work on the GHS built-up grid
Tegel Median Age
Median Age: 43 years
| Location | Median Age | Median Age (Female) | Median Age (Male) |
|---|---|---|---|
| Tegel | 43 yrs | 44 yrs | 42 yrs |
| Berlin | 43 yrs | 44.1 yrs | 42 yrs |
| Germany | 44.8 yrs | 46 yrs | 43.6 yrs |
Sources: CIESIN (Center for International Earth Science Information Network)
Tegel Population Density
Population Density: 1,732 / km²
| Location | Population | Area | Density |
|---|---|---|---|
| Tegel | 57,360 | 33.1 km² | 1,732 / km² |
| Berlin | 3.3 million | 891.8 km² | 3,754 / km² |
| Germany | 80.7 million | 358,179.8 km² | 225 / km² |
Sources: JRC (European Commission's Joint Research Centre) work on the GHS built-up grid
Tegel Historical and Projected Population
Estimated Population from 1730 to 2100
Sources:
- JRC (European Commission's Joint Research Centre) work on the GHS built-up grid
- CIESIN (Center for International Earth Science Information Network)
- [Link] Klein Goldewijk, K., Beusen, A., Doelman, J., and Stehfest, E.: Anthropogenic land use estimates for the Holocene – HYDE 3.2, Earth Syst. Sci. Data, 9, 927–953, https://doi.org/10.5194/essd-9-927-2017, 2017.
Human Development Index (HDI)
Statistic composite index of life expectancy, education, and per capita income.
Source: [Link] Kummu, M., Taka, M. &Guillaume, J. Gridded global datasets for Gross Domestic Product and Human Development Index over 1990–2015. Sci Data 5, 180004 (2018) doi:10.1038/sdata.2018.4
Tegel CO2 Emissions
Carbon Dioxide (CO2) Emissions Per Capita in Tonnes Per Year
| Location | CO2 Emissions | CO2 Emissions Per Capita | CO2 Emissions Intensity |
|---|---|---|---|
| Tegel | 601,112 tn | 10.48 tn | 18,146.8 tons/km² |
| Berlin | 34,879,850 tn | 10.42 tn | 39,110.2 tons/km² |
| Germany | 755,339,039 tn | 9.36 tn | 2,108.8 tons/km² |
Sources: [Link] Moran, D., Kanemoto K; Jiborn, M., Wood, R., Többen, J., and Seto, K.C. (2018) Carbon footprints of 13,000 cities. Environmental Research Letters DOI: 10.1088/1748-9326/aac72a
Tegel CO2 Emissions
| 2013 CO2 emissions (tonnes/year) | 601,112 tn |
| 2013 CO2 emissions (tonnes/year) per capita | 10.48 tn |
| 2013 CO2 emissions intensity (tonnes/km²/year) | 18,146.8 tons/km² |
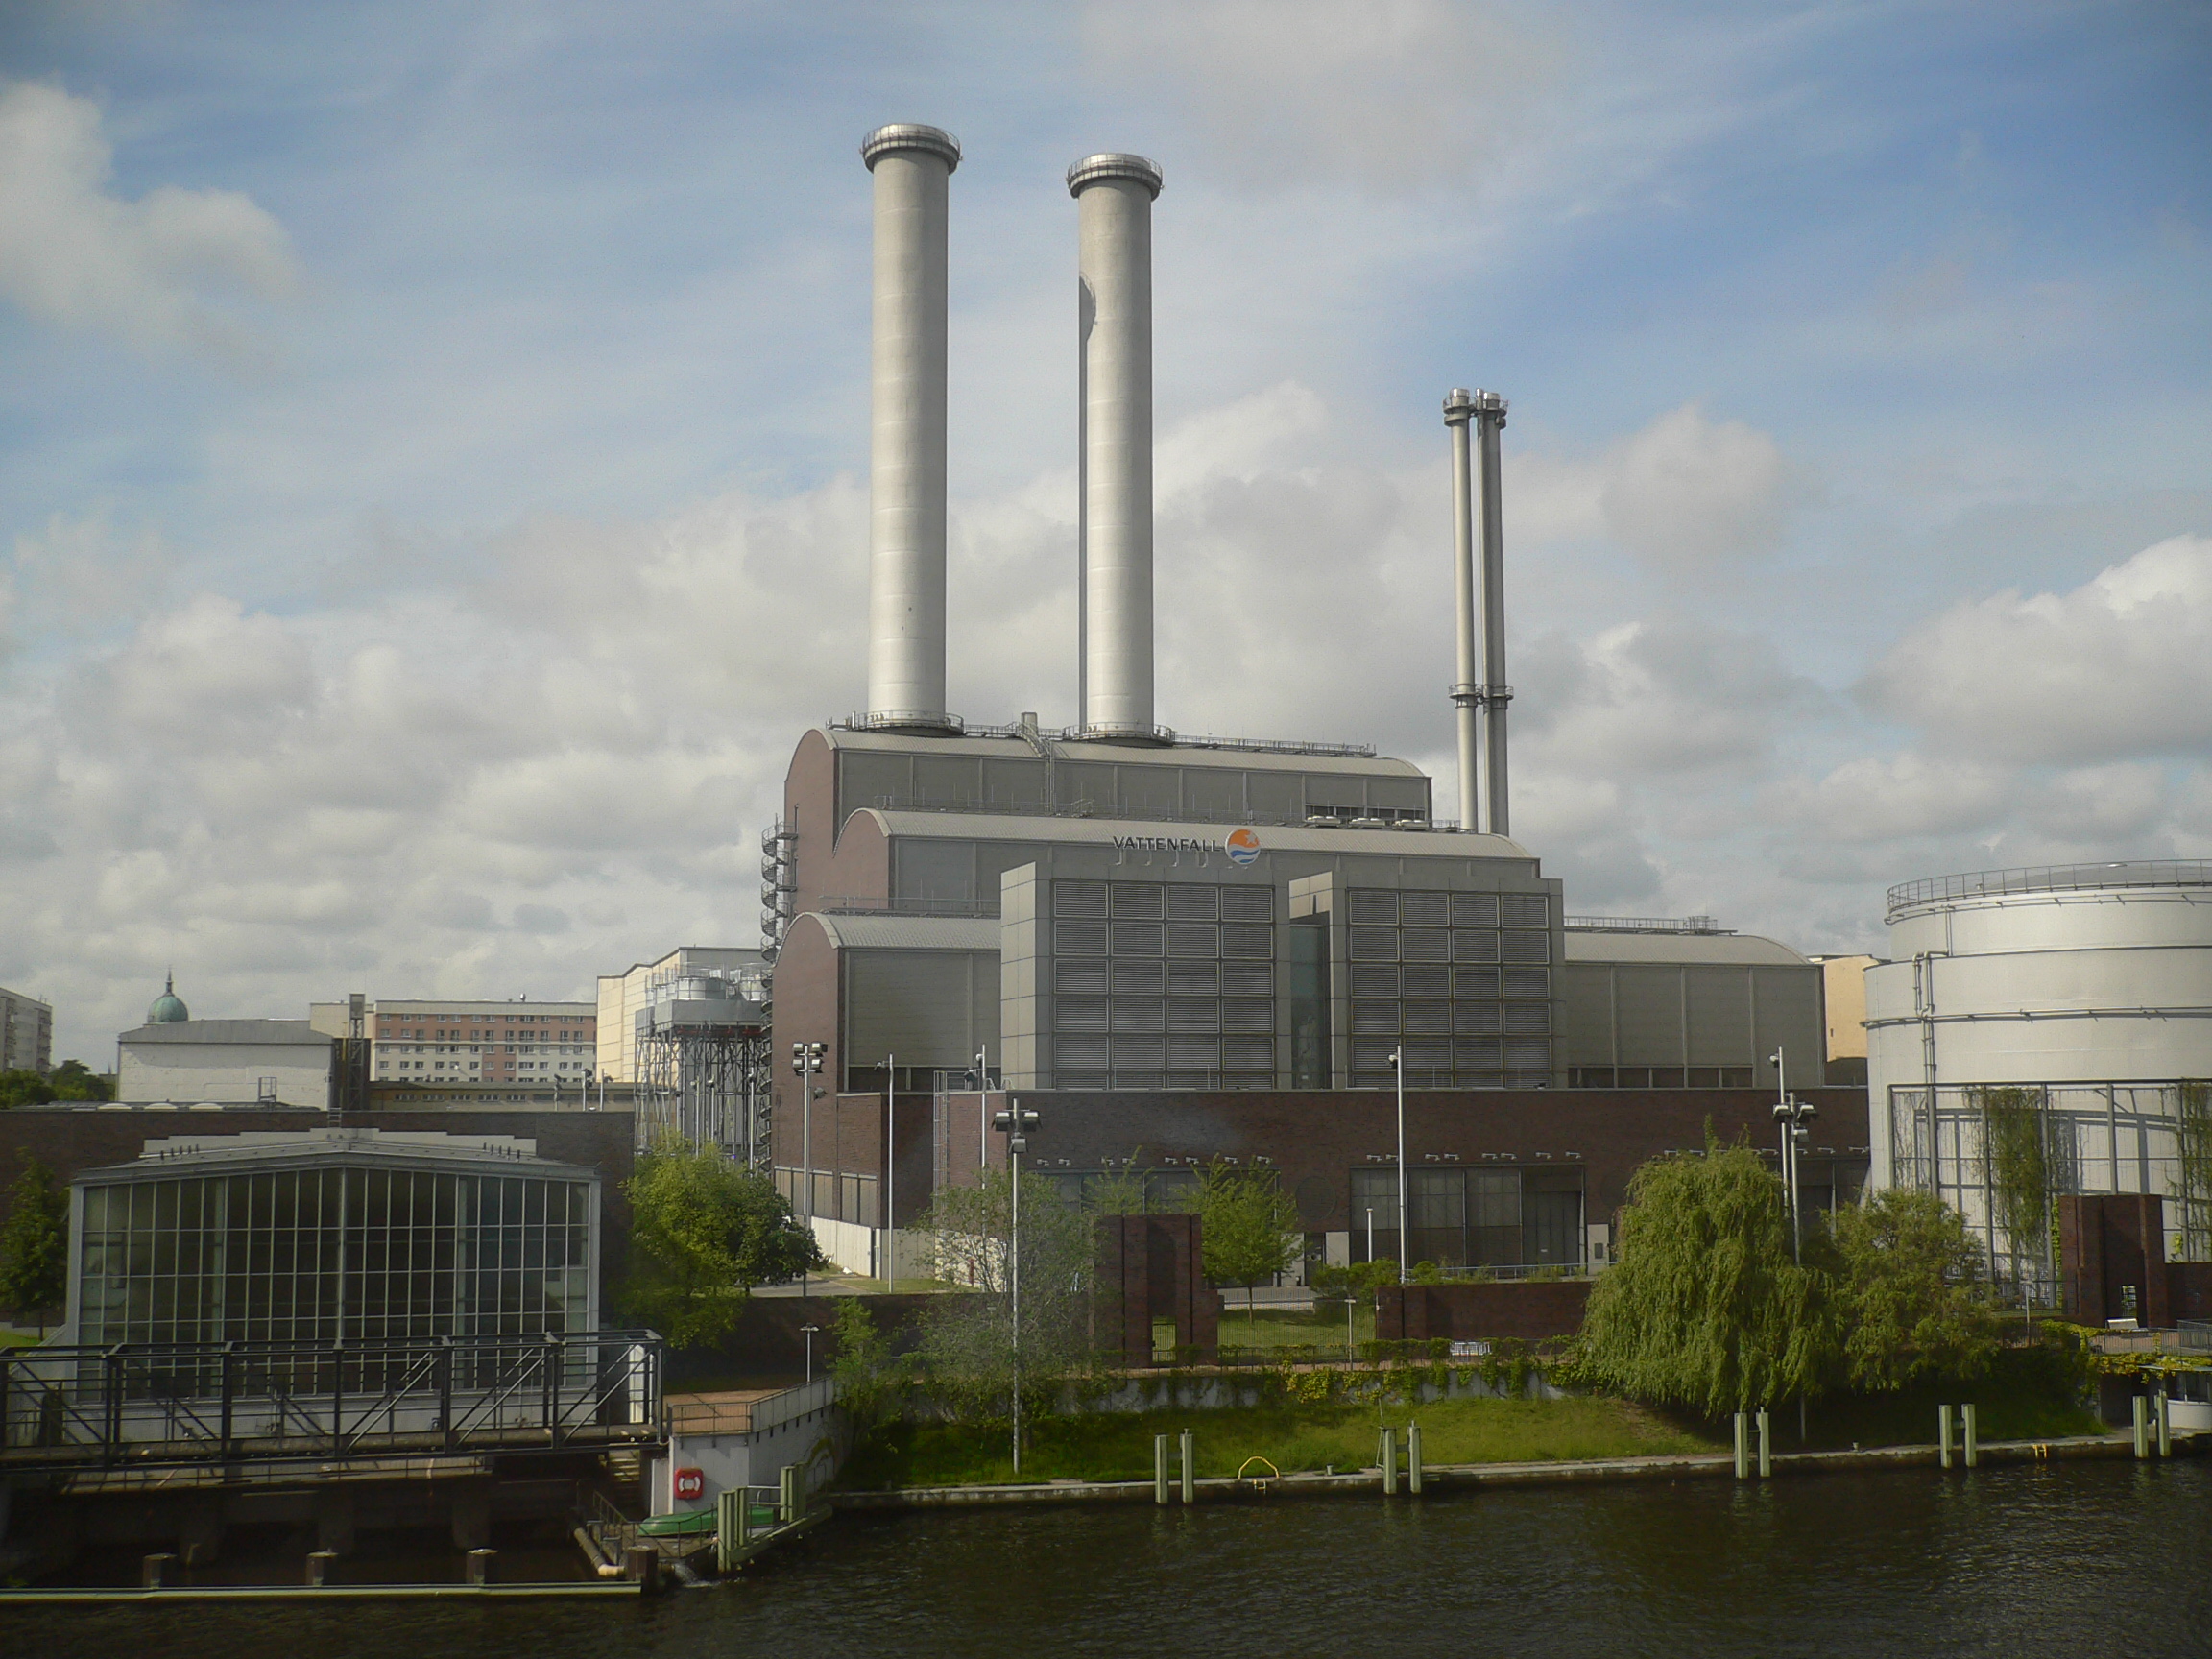
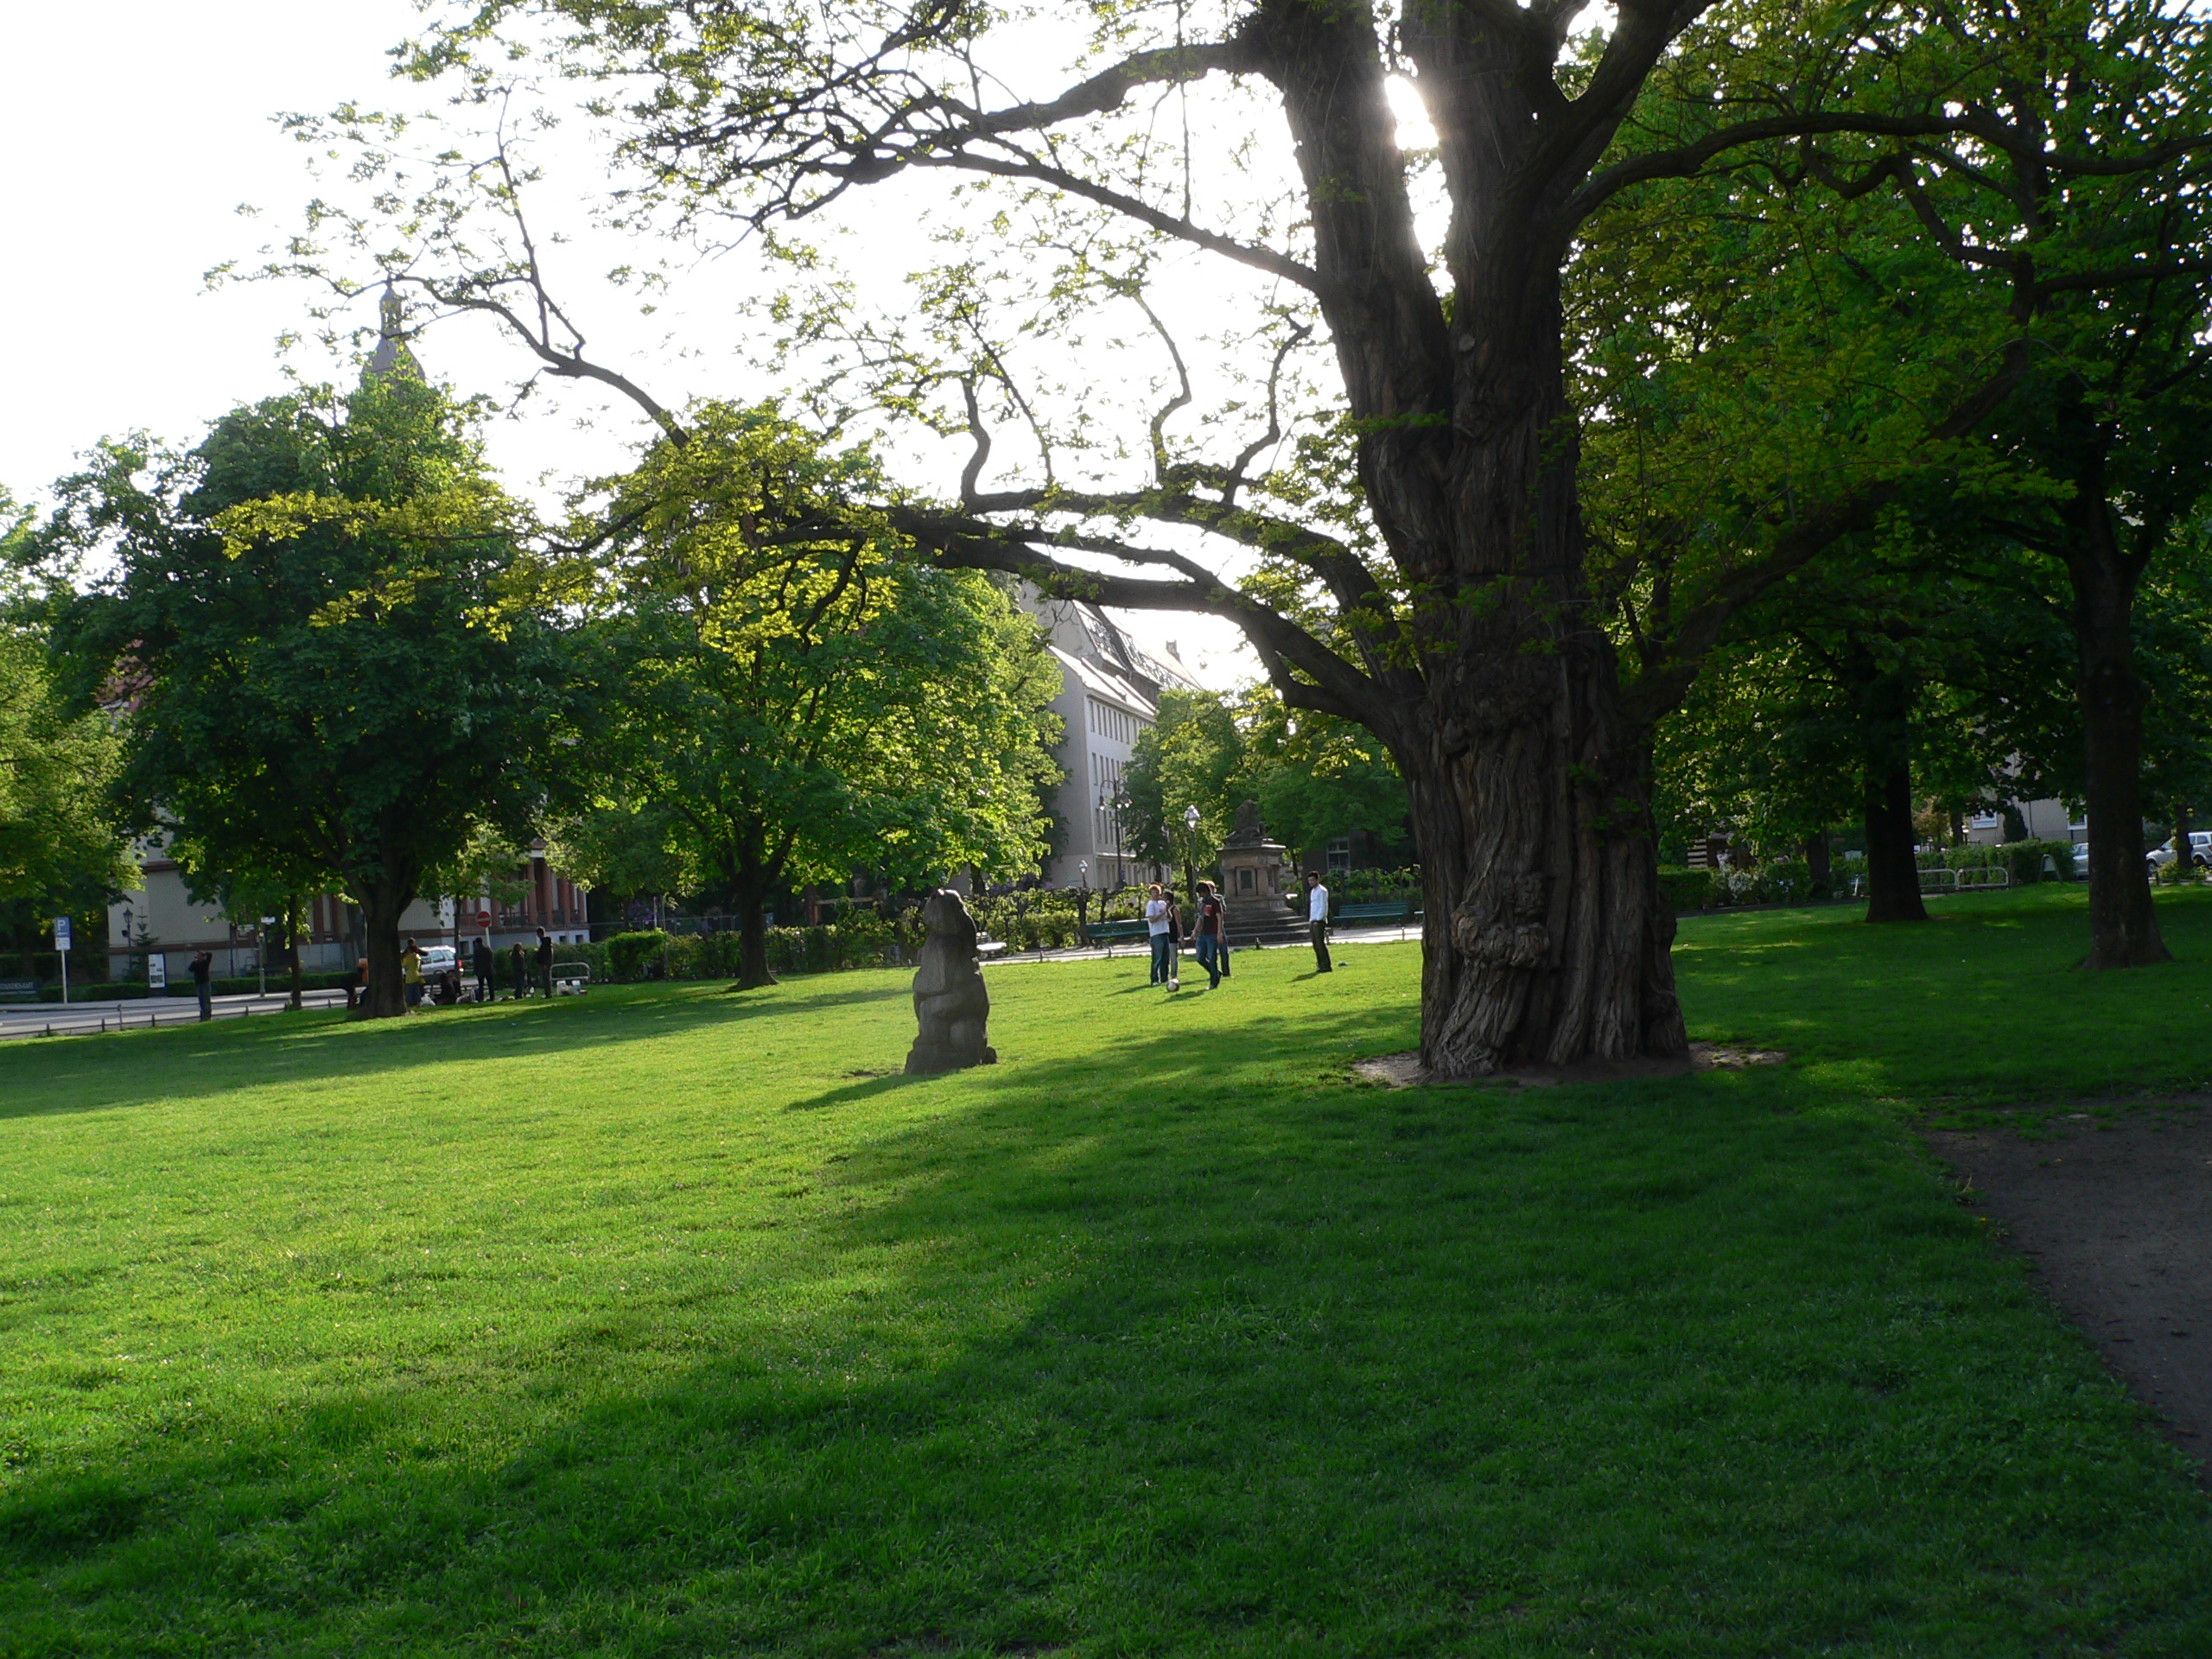
Tegel
Tegel is a locality (Ortsteil) in the Berlin borough of Reinickendorf on the shore of Lake Tegel. The Tegel locality, the second largest in area (after Köpenick) of the 96 Berlin districts, also includes the neighbourhood of Saatwinkel.
Tegel Wikipedia Page

About Our Data
The data on this page is estimated using a number of publicly available tools and resources. It is provided without warranty, and could contain inaccuracies. Use at your own risk.