Categories in Warnemünde
Industries
Business Distribution by Industry in Warnemünde
| Industry Description | Number of Establishments |
|---|---|
| Dentists | 10 |
Warnemünde Facts
| Area | 5.3 km² |
| Population | 12,061 |
| Male Population | 5,932 (49.2%) |
| Female Population | 6,129 (50.8%) |
| Population change (1975 to 2020) | -16.2% |
| Population change (2000 to 2020) | -1.8% |
| Median Age | 44.8 years (Male: 42.3, Female: 47.1) |
| Neighborhoods | Ortsamt 1 |
| Local Time | |
| Timezone | Central European Summer Time |
| Lat & Lng | 54.17670, 12.08402 |
Map of Warnemünde
Interactive Map
Warnemünde Population
Years 1975 to 2020
| Data | 1975 | 1990 | 2000 | 2015 | 2020 |
|---|---|---|---|---|---|
| Population | 14,387 | 12,461 | 12,283 | 11,971 | 12,061 |
| Population Density | 2,708.1 / km² | 2,345.6 / km² | 2,312.1 / km² | 2,253.4 / km² | 2,270.3 / km² |
Warnemünde Population change from 2000 to 2015
Decrease of 2.5% from year 2000 to 2015
| Location | Change since 1975 | Change since 1990 | Change since 2000 |
|---|---|---|---|
| Warnemünde | -16.8% | -3.9% | -2.5% |
| Mecklenburg-Vorpommern | -19.6% | -12.3% | -10.1% |
| Germany | +2.6% | +2.2% | -1.5% |
Warnemünde Median Age
Median Age: 44.8 years
| Location | Median Age | Median Age (Female) | Median Age (Male) |
|---|---|---|---|
| Warnemünde | 44.8 yrs | 47.1 yrs | 42.3 yrs |
| Mecklenburg-Vorpommern | 47.5 yrs | 49.1 yrs | 46 yrs |
| Germany | 44.8 yrs | 46 yrs | 43.6 yrs |
Warnemünde Population Density
Population Density: 2,270 / km²
| Location | Population | Area | Density |
|---|---|---|---|
| Warnemünde | 12,061 | 5.3 km² | 2,270 / km² |
| Mecklenburg-Vorpommern | 1.6 million | 23,289 km² | 66.9 / km² |
| Germany | 80.7 million | 358,179.8 km² | 225 / km² |
Warnemünde Historical and Projected Population
Estimated Population from 1300 to 2100
- JRC (European Commission's Joint Research Centre) work on the GHS built-up grid
- CIESIN (Center for International Earth Science Information Network)
- [Link] Klein Goldewijk, K., Beusen, A., Doelman, J., and Stehfest, E.: Anthropogenic land use estimates for the Holocene – HYDE 3.2, Earth Syst. Sci. Data, 9, 927–953, https://doi.org/10.5194/essd-9-927-2017, 2017.
Price Distribution
Business distribution by price for Warnemünde
Human Development Index (HDI)
Statistic composite index of life expectancy, education, and per capita income.
Warnemünde CO2 Emissions
Carbon Dioxide (CO2) Emissions Per Capita in Tonnes Per Year
| Location | CO2 Emissions | CO2 Emissions Per Capita | CO2 Emissions Intensity |
|---|---|---|---|
| Warnemünde | 106,237 tn | 8.81 tn | 19,997.5 tons/km² |
| Mecklenburg-Vorpommern | 14,301,725 tn | 9.18 tn | 614.1 tons/km² |
| Germany | 755,339,039 tn | 9.36 tn | 2,108.8 tons/km² |
| 2013 CO2 emissions (tonnes/year) | 106,237 tn |
| 2013 CO2 emissions (tonnes/year) per capita | 8.81 tn |
| 2013 CO2 emissions intensity (tonnes/km²/year) | 19,997.5 tons/km² |
Recent Nearby Earthquakes
Magnitude 3.0 and greater
| Date▼ | Time↕ | Magnitude↕ | Distance↕ | Depth↕ | Location↕ | Link |
|---|---|---|---|---|---|---|
| 7/21/01 | 4:35 PM | 3.5 | 33.6 km | 10,000 m | Germany | usgs.gov |
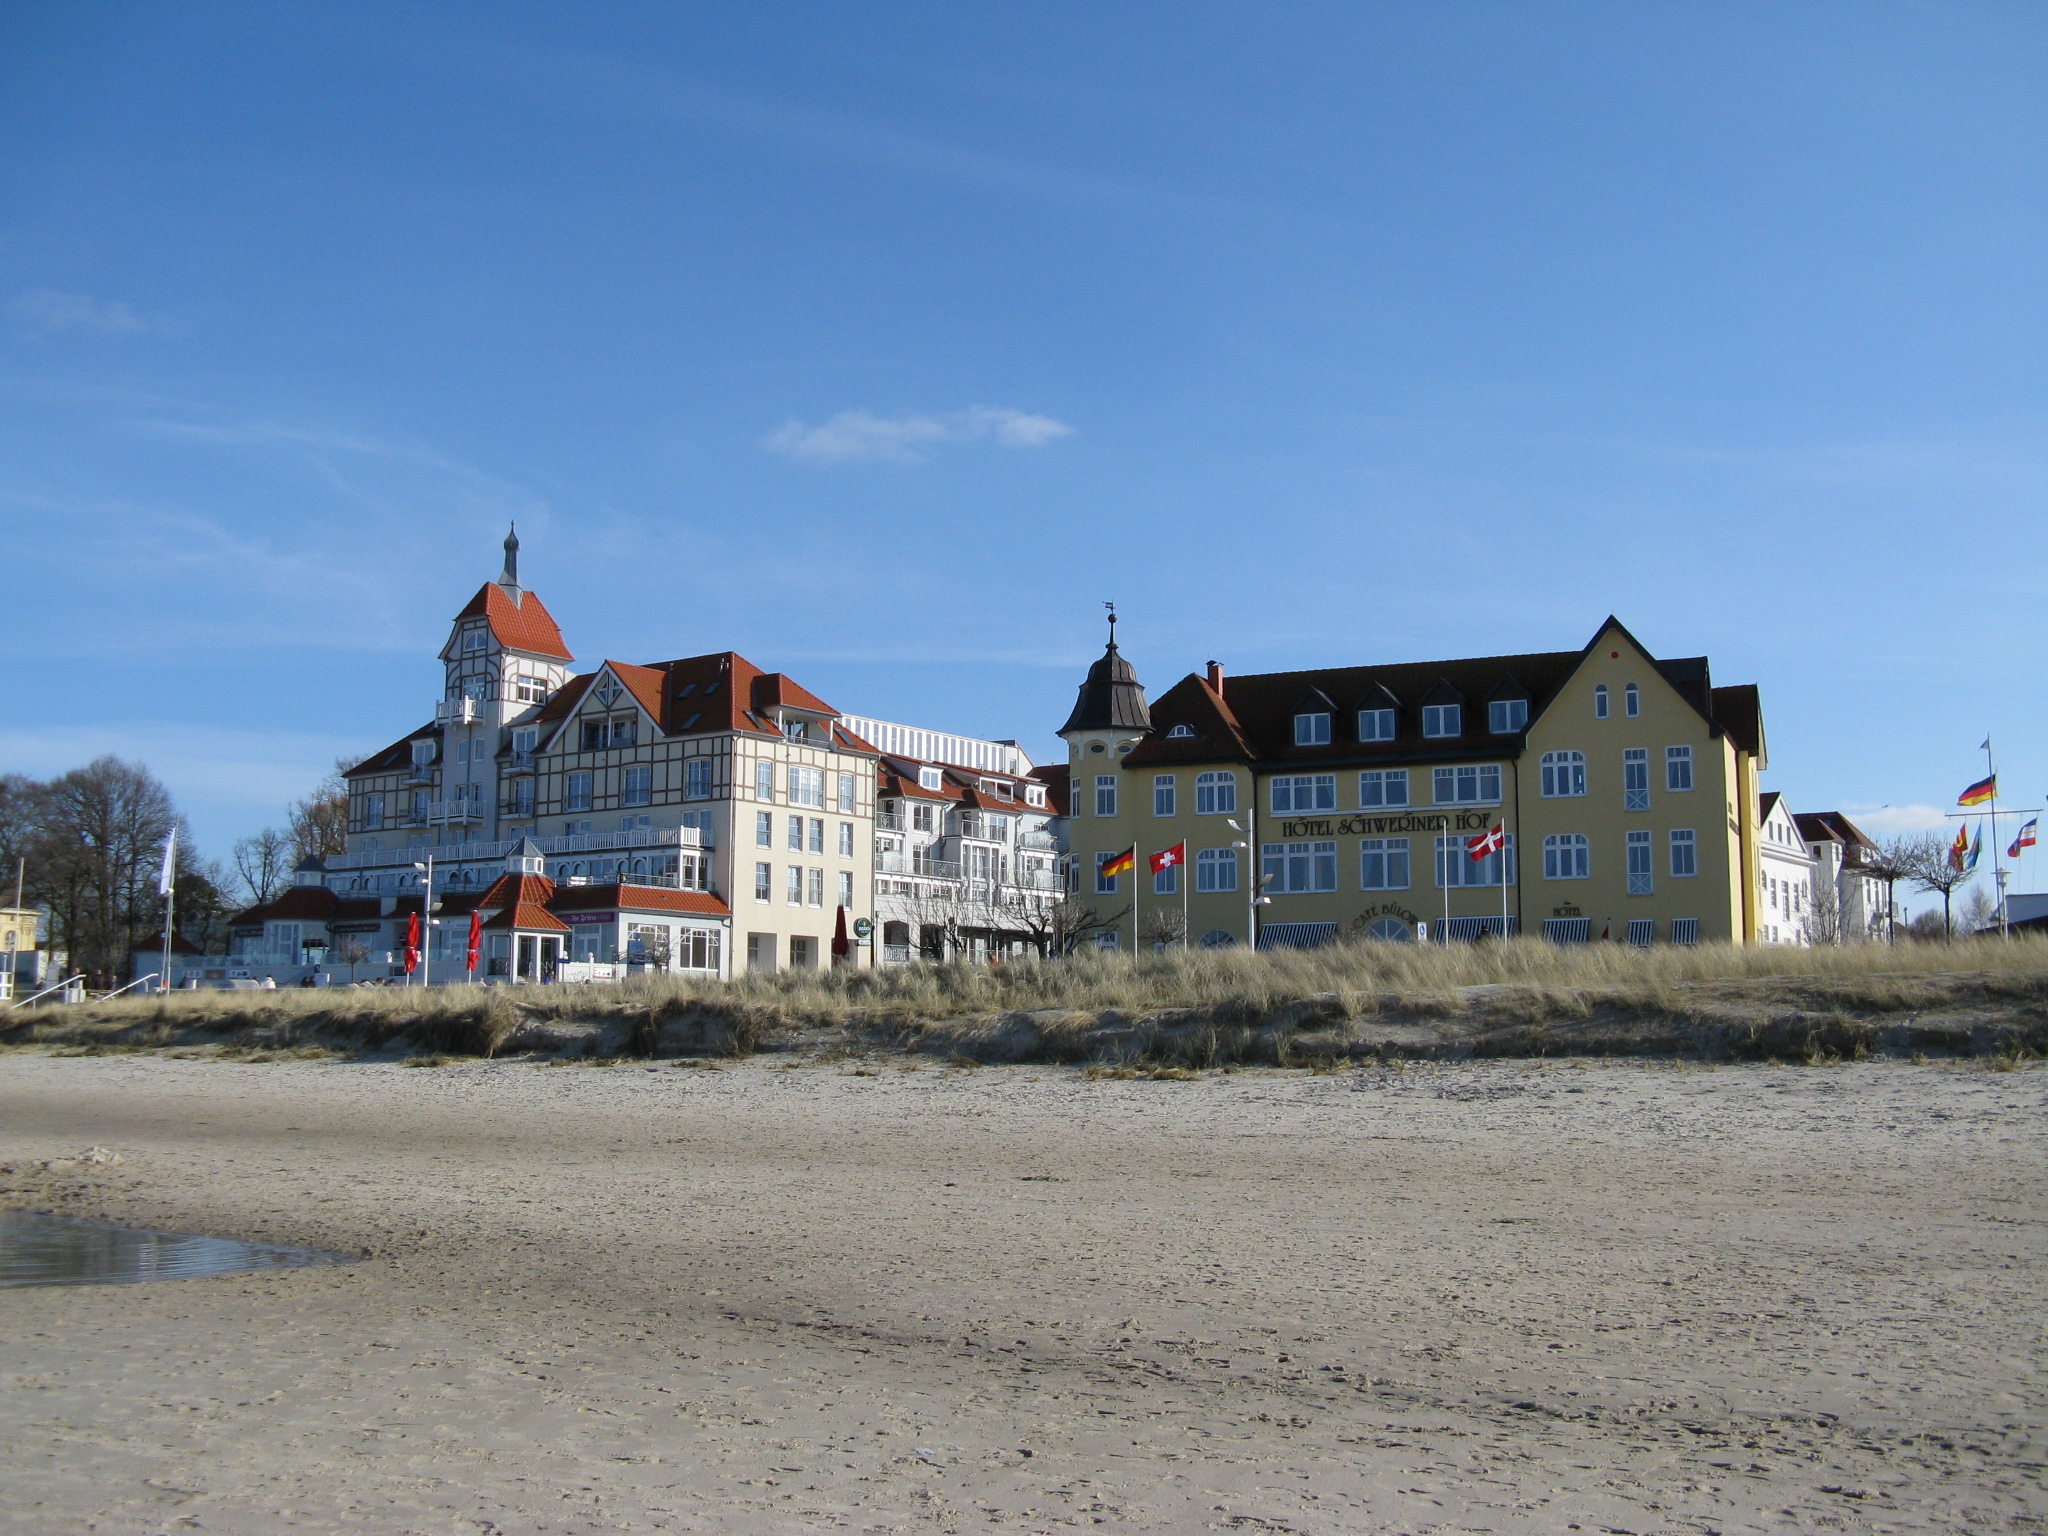
Warnemünde
Warnemünde (German pronunciation: [vaʁnəˈmʏndə], literally Mouth of the Warnow) is a seaside resort and a district of the city of Rostock in Mecklenburg, Germany. It is located on the Baltic Sea and, as the name implies, at the estuary of the river W..
Warnemünde Wikipedia Page


About Our Data
The data on this page is estimated using a number of publicly available tools and resources. It is provided without warranty, and could contain inaccuracies. Use at your own risk.