Categories in Wehrbleck
Industries
Business Distribution by Industry in Wehrbleck
| Industry Description | Number of Establishments |
|---|---|
| Tractors and farm equipment | 10 |
Map of Wehrbleck
Interactive Map
Wehrbleck Population
Years 1975 to 2020
| Data | 1975 | 1990 | 2000 | 2015 | 2020 |
|---|---|---|---|---|---|
| Population | 253 | 244 | 256 | 263 | 254 |
| Population Density | 674.7 / km² | 650.7 / km² | 682.7 / km² | 701.3 / km² | 677.3 / km² |
Sources: JRC (European Commission's Joint Research Centre) work on the GHS built-up grid
Wehrbleck Population change from 2000 to 2015
Increase of 2.7% from year 2000 to 2015
| Location | Change since 1975 | Change since 1990 | Change since 2000 |
|---|---|---|---|
| Wehrbleck | +4% | +7.8% | +2.7% |
| Lower Saxony | +4.3% | +2.8% | -1.3% |
| Germany | +2.6% | +2.2% | -1.5% |
Sources: JRC (European Commission's Joint Research Centre) work on the GHS built-up grid
Wehrbleck Population Density
Population Density: 677 / km²
| Location | Population | Area | Density |
|---|---|---|---|
| Wehrbleck | 254 | 0.375 km² | 677 / km² |
| Lower Saxony | 7.8 million | 47,789.6 km² | 164 / km² |
| Germany | 80.7 million | 358,179.8 km² | 225 / km² |
Sources: JRC (European Commission's Joint Research Centre) work on the GHS built-up grid
Wehrbleck Historical and Projected Population
Estimated Population from 0 to 2100
Sources:
- JRC (European Commission's Joint Research Centre) work on the GHS built-up grid
- CIESIN (Center for International Earth Science Information Network)
- [Link] Klein Goldewijk, K., Beusen, A., Doelman, J., and Stehfest, E.: Anthropogenic land use estimates for the Holocene – HYDE 3.2, Earth Syst. Sci. Data, 9, 927–953, https://doi.org/10.5194/essd-9-927-2017, 2017.
Area Codes
Percentage Area Codes used by businesses in Wehrbleck
Human Development Index (HDI)
Statistic composite index of life expectancy, education, and per capita income.
Source: [Link] Kummu, M., Taka, M. &Guillaume, J. Gridded global datasets for Gross Domestic Product and Human Development Index over 1990–2015. Sci Data 5, 180004 (2018) doi:10.1038/sdata.2018.4
Wehrbleck CO2 Emissions
Carbon Dioxide (CO2) Emissions Per Capita in Tonnes Per Year
| Location | CO2 Emissions | CO2 Emissions Per Capita | CO2 Emissions Intensity |
|---|---|---|---|
| Wehrbleck | 2,611 tn | 10.28 tn | 6,963.7 tons/km² |
| Lower Saxony | 78,468,653 tn | 10.03 tn | 1,642 tons/km² |
| Germany | 755,339,039 tn | 9.36 tn | 2,108.8 tons/km² |
Sources: [Link] Moran, D., Kanemoto K; Jiborn, M., Wood, R., Többen, J., and Seto, K.C. (2018) Carbon footprints of 13,000 cities. Environmental Research Letters DOI: 10.1088/1748-9326/aac72a
Wehrbleck CO2 Emissions
| 2013 CO2 emissions (tonnes/year) | 2,611 tn |
| 2013 CO2 emissions (tonnes/year) per capita | 10.28 tn |
| 2013 CO2 emissions intensity (tonnes/km²/year) | 6,963.7 tons/km² |
Recent Nearby Earthquakes
Magnitude 3.0 and greater
| Date▼ | Time↕ | Magnitude↕ | Distance↕ | Depth↕ | Location↕ | Link |
|---|---|---|---|---|---|---|
| 7/18/08 | 6:12 PM | 3.4 | 77.5 km | 5,000 m | Germany | usgs.gov |
| 3/20/07 | 7:54 PM | 3.7 | 79.3 km | 10,000 m | Germany | usgs.gov |
| 7/2/06 | 2:37 PM | 3 | 62.2 km | 5,000 m | Germany | usgs.gov |
| 7/15/05 | 3:02 PM | 4 | 33.5 km | 10,000 m | Germany | usgs.gov |
| 10/20/04 | 6:59 AM | 4.5 | 67.5 km | 5,500 m | Germany | usgs.gov |
| 1/6/03 | 9:49 PM | 4.3 | 81.3 km | 10,000 m | Germany | usgs.gov |
| 12/29/01 | 8:44 PM | 3 | 76.6 km | 2,000 m | Germany | usgs.gov |
| 6/28/96 | 6:05 PM | 3 | 98.9 km | 10,000 m | Germany | usgs.gov |
| 8/3/95 | 5:47 PM | 3.6 | 90.2 km | 10,000 m | Germany | usgs.gov |
| 1/29/94 | 5:52 AM | 3.7 | 76.4 km | 5,000 m | Germany | usgs.gov |
Source: U.S. Geological Survey (USGS)
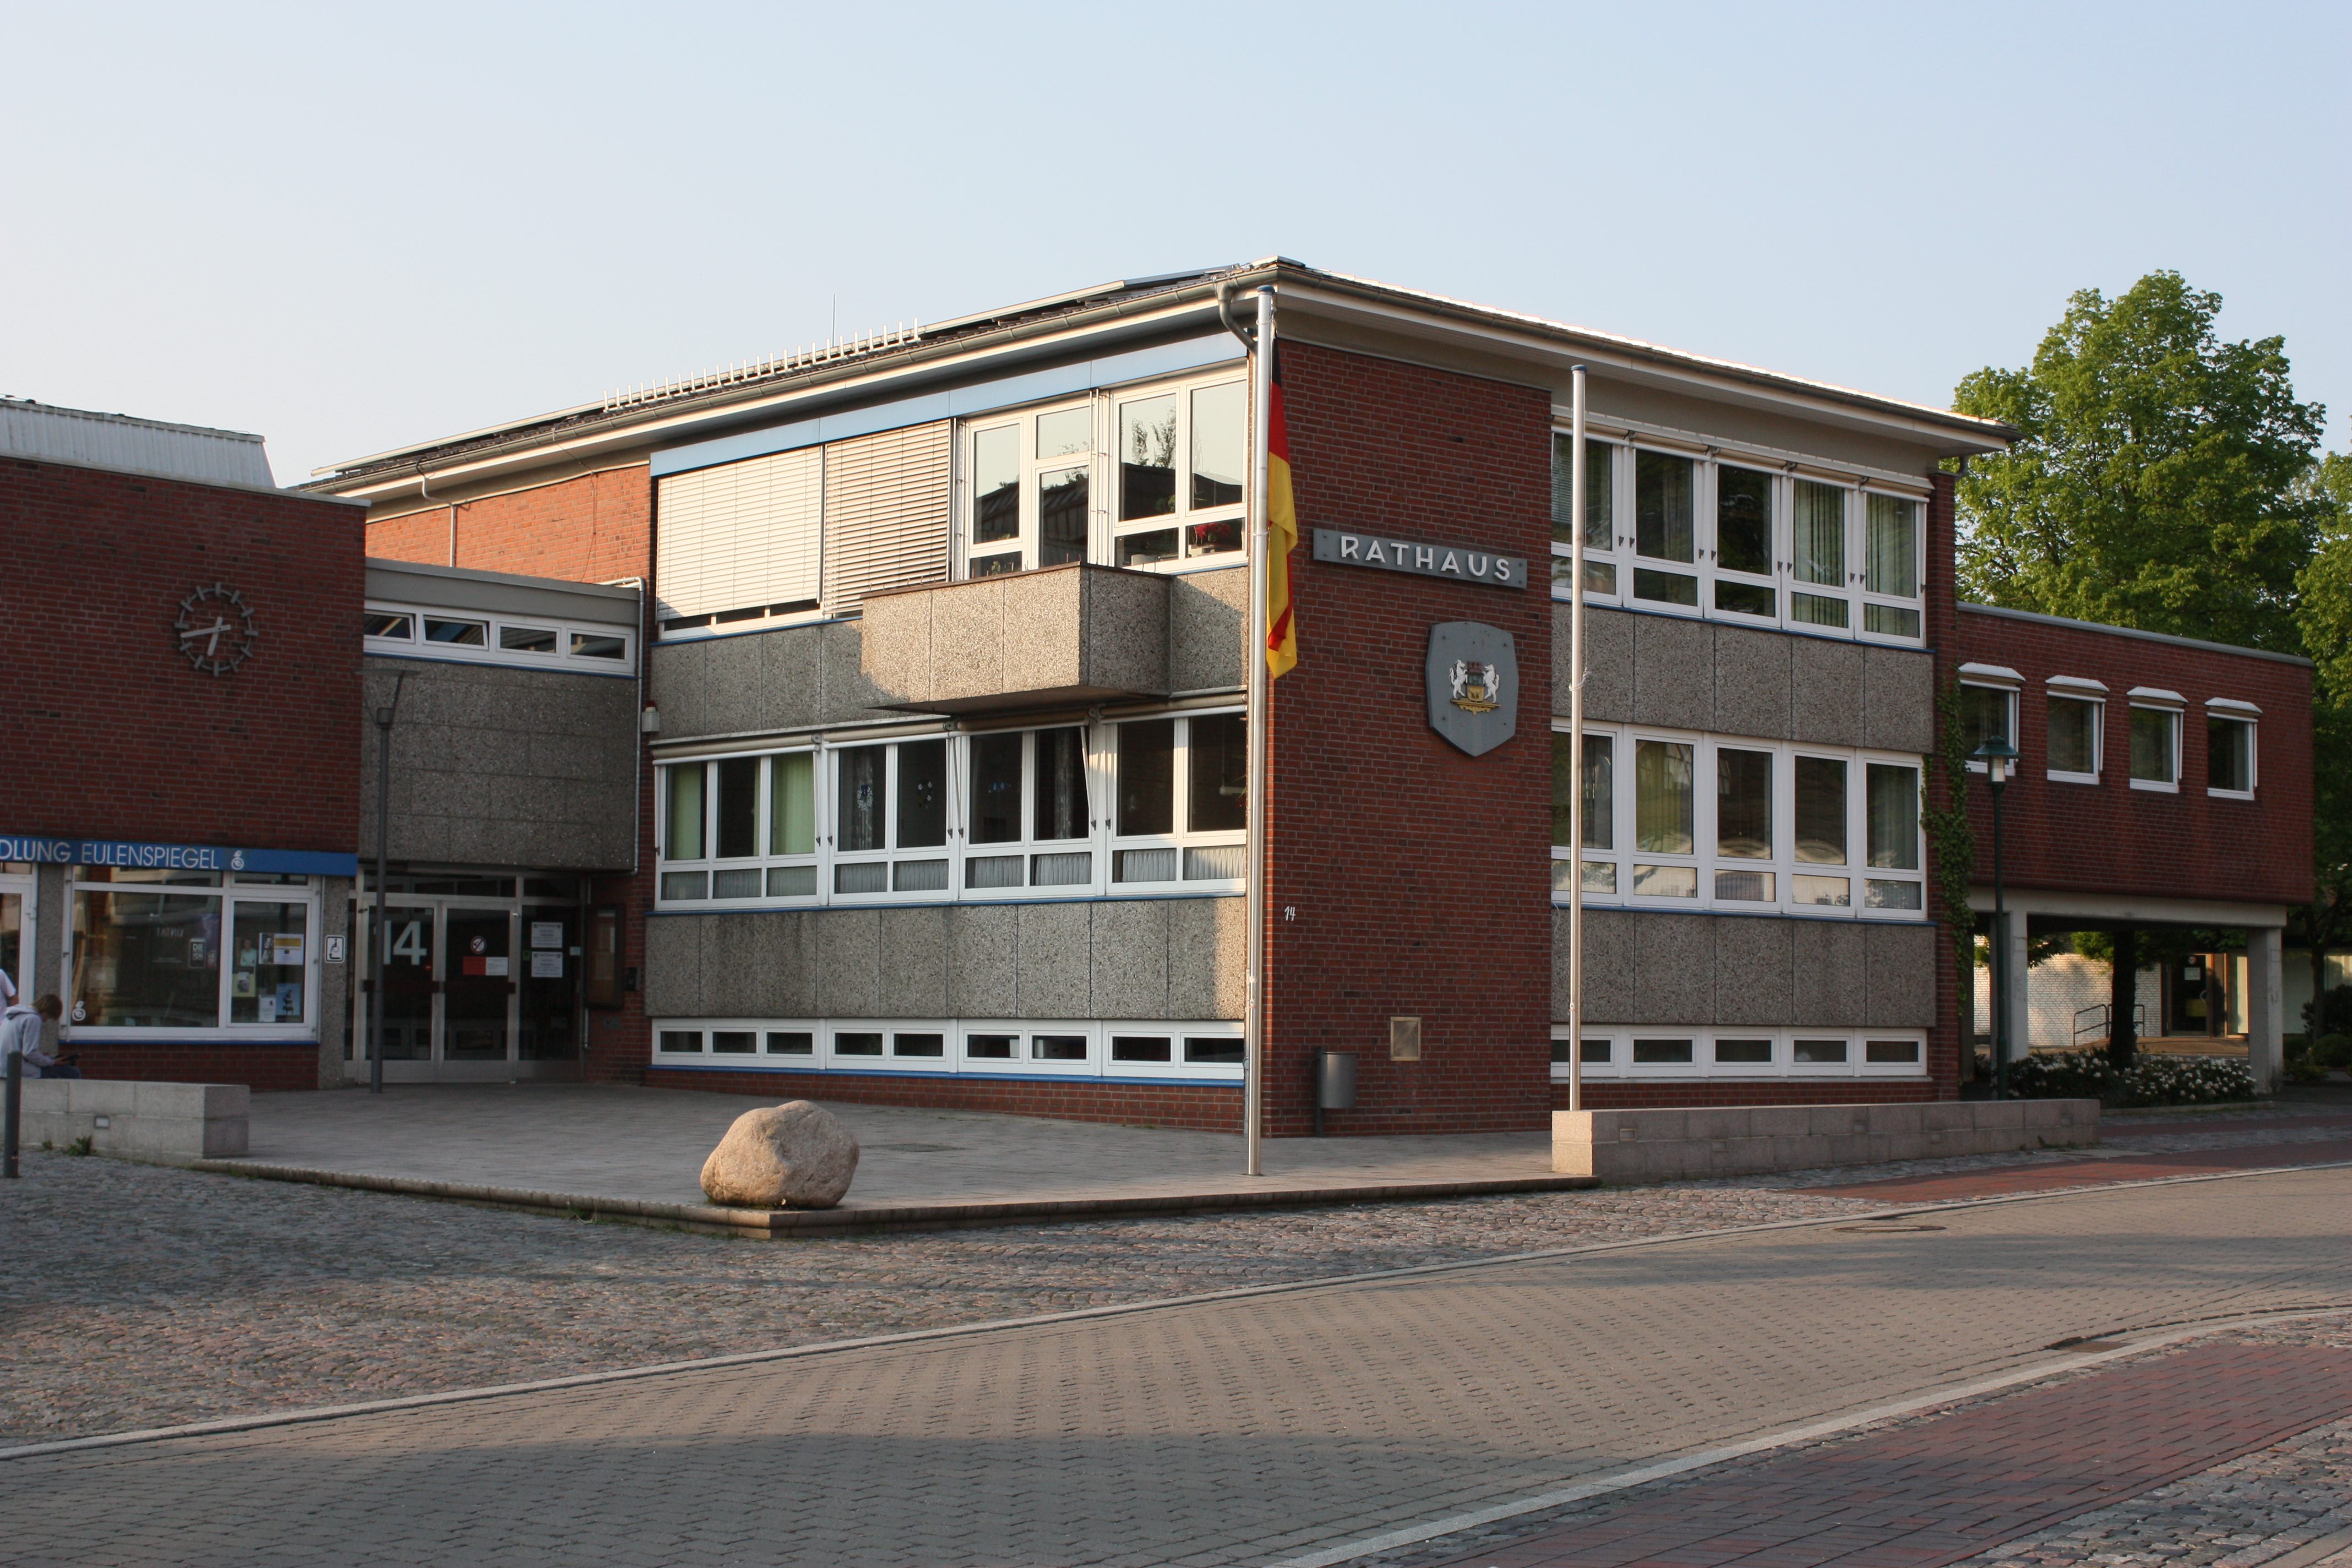
Wehrbleck
Wehrbleck is a municipality in the district of Diepholz, in Lower Saxony, Germany.
Wehrbleck Wikipedia Page
About Our Data
The data on this page is estimated using a number of publicly available tools and resources. It is provided without warranty, and could contain inaccuracies. Use at your own risk.