Wohlde Facts
| Area | 0.4 km² |
| Population | 229 |
| Population change (1975 to 2020) | -15.2% |
| Population change (2000 to 2020) | -11.6% |
| Local Time | |
| Timezone | Central European Summer Time |
| Lat & Lng | 54.40614, 9.29890 |
| Postal Codes | 24899 |
Map of Wohlde
Interactive Map
Wohlde Population
Years 1975 to 2020
| Data | 1975 | 1990 | 2000 | 2015 | 2020 |
|---|---|---|---|---|---|
| Population | 270 | 247 | 259 | 236 | 229 |
| Population Density | 617.1 / km² | 564.6 / km² | 592 / km² | 539.4 / km² | 523.4 / km² |
Sources: JRC (European Commission's Joint Research Centre) work on the GHS built-up grid
Wohlde Population change from 2000 to 2015
Decrease of 8.9% from year 2000 to 2015
| Location | Change since 1975 | Change since 1990 | Change since 2000 |
|---|---|---|---|
| Wohlde | -12.6% | -4.5% | -8.9% |
| Schleswig-Holstein | +14.9% | +9.1% | +2.3% |
| Germany | +2.6% | +2.2% | -1.5% |
Sources: JRC (European Commission's Joint Research Centre) work on the GHS built-up grid
Wohlde Population Density
Population Density: 523 / km²
| Location | Population | Area | Density |
|---|---|---|---|
| Wohlde | 229 | 0.438 km² | 523 / km² |
| Schleswig-Holstein | 2.8 million | 15,915.1 km² | 177 / km² |
| Germany | 80.7 million | 358,179.8 km² | 225 / km² |
Sources: JRC (European Commission's Joint Research Centre) work on the GHS built-up grid
Wohlde Historical and Projected Population
Estimated Population from 0 to 2100
Sources:
- JRC (European Commission's Joint Research Centre) work on the GHS built-up grid
- CIESIN (Center for International Earth Science Information Network)
- [Link] Klein Goldewijk, K., Beusen, A., Doelman, J., and Stehfest, E.: Anthropogenic land use estimates for the Holocene – HYDE 3.2, Earth Syst. Sci. Data, 9, 927–953, https://doi.org/10.5194/essd-9-927-2017, 2017.
Area Codes
Percentage Area Codes used by businesses in Wohlde
Human Development Index (HDI)
Statistic composite index of life expectancy, education, and per capita income.
Source: [Link] Kummu, M., Taka, M. &Guillaume, J. Gridded global datasets for Gross Domestic Product and Human Development Index over 1990–2015. Sci Data 5, 180004 (2018) doi:10.1038/sdata.2018.4
Wohlde CO2 Emissions
Carbon Dioxide (CO2) Emissions Per Capita in Tonnes Per Year
| Location | CO2 Emissions | CO2 Emissions Per Capita | CO2 Emissions Intensity |
|---|---|---|---|
| Wohlde | 2,177 tn | 9.51 tn | 4,975.7 tons/km² |
| Schleswig-Holstein | 27,326,926 tn | 9.68 tn | 1,717 tons/km² |
| Germany | 755,339,039 tn | 9.36 tn | 2,108.8 tons/km² |
Sources: [Link] Moran, D., Kanemoto K; Jiborn, M., Wood, R., Többen, J., and Seto, K.C. (2018) Carbon footprints of 13,000 cities. Environmental Research Letters DOI: 10.1088/1748-9326/aac72a
Wohlde CO2 Emissions
| 2013 CO2 emissions (tonnes/year) | 2,177 tn |
| 2013 CO2 emissions (tonnes/year) per capita | 9.51 tn |
| 2013 CO2 emissions intensity (tonnes/km²/year) | 4,975.7 tons/km² |
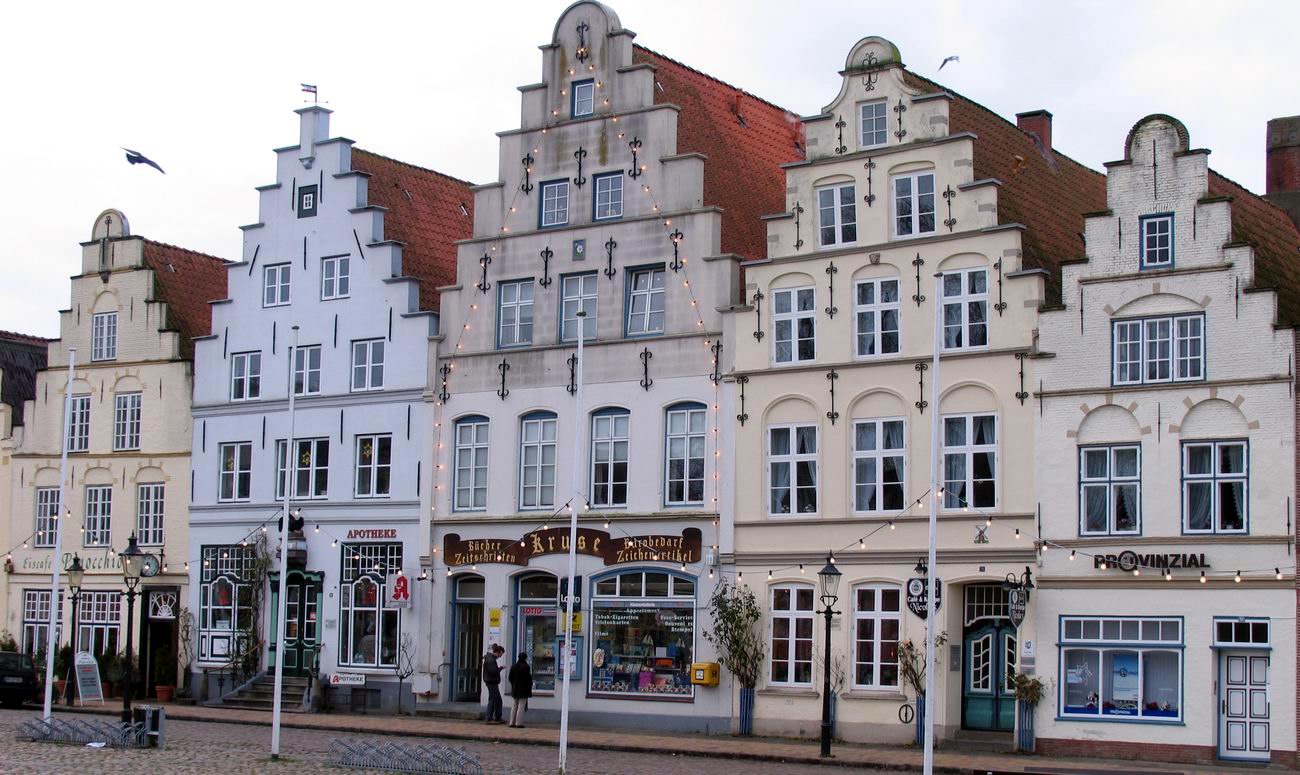
Wohlde
Wohlde (Danish: Volde) is a municipality in the district of Schleswig-Flensburg, in Schleswig-Holstein, Germany.
Wohlde Wikipedia Page
About Our Data
The data on this page is estimated using a number of publicly available tools and resources. It is provided without warranty, and could contain inaccuracies. Use at your own risk.