Obock Facts
| Area | 2374.5 km² |
| Population | 45,025 |
| Male Population | 24,248 (53.9%) |
| Female Population | 20,777 (46.1%) |
| Population change (1975 to 2020) | +1065.8% |
| Population change (2000 to 2020) | +90.5% |
| Median Age | 22.1 years (Male: 21.6, Female: 22.6) |
| Local Time | |
| Timezone | East Africa Time |
| Lat & Lng | 11.96306, 43.29056 |
Map of Obock
Interactive Map
Obock Population
Years 1975 to 2020
| Data | 1975 | 1990 | 2000 | 2015 | 2020 |
|---|---|---|---|---|---|
| Population | 3,862 | 14,711 | 23,631 | 41,673 | 45,025 |
| Population Density | 1.6 / km² | 6.2 / km² | 10 / km² | 17.6 / km² | 19 / km² |
Obock Population change from 2000 to 2015
Increase of 76.3% from year 2000 to 2015
| Location | Change since 1975 | Change since 1990 | Change since 2000 |
|---|---|---|---|
| Obock | +979.1% | +183.3% | +76.3% |
| Obock Region | +1021.1% | +183.8% | +76.7% |
| Djibouti | +301.9% | +51.8% | +24.7% |
Obock Median Age
Median Age: 22.1 years
| Location | Median Age | Median Age (Female) | Median Age (Male) |
|---|---|---|---|
| Obock | 22.1 yrs | 22.6 yrs | 21.6 yrs |
| Obock Region | 22.1 yrs | 22.6 yrs | 21.6 yrs |
| Djibouti | 22.1 yrs | 22.6 yrs | 21.6 yrs |
Obock Population Density
Population Density: 19 / km²
| Location | Population | Area | Density |
|---|---|---|---|
| Obock | 45,025 | 2,374.5 km² | 19 / km² |
| Obock Region | 45,840 | 4,439.8 km² | 10.3 / km² |
| Djibouti | 820,439 | 21,622.4 km² | 37.9 / km² |
Obock Historical and Projected Population
Estimated Population from 1500 to 2100
- JRC (European Commission's Joint Research Centre) work on the GHS built-up grid
- CIESIN (Center for International Earth Science Information Network)
- [Link] Klein Goldewijk, K., Beusen, A., Doelman, J., and Stehfest, E.: Anthropogenic land use estimates for the Holocene – HYDE 3.2, Earth Syst. Sci. Data, 9, 927–953, https://doi.org/10.5194/essd-9-927-2017, 2017.
Human Development Index (HDI)
Statistic composite index of life expectancy, education, and per capita income.
Obock CO2 Emissions
Carbon Dioxide (CO2) Emissions Per Capita in Tonnes Per Year
| Location | CO2 Emissions | CO2 Emissions Per Capita | CO2 Emissions Intensity |
|---|---|---|---|
| Obock | 67,280 tn | 1.49 tn | 28.3 tons/km² |
| Obock Region | 68,161 tn | 1.49 tn | 15.4 tons/km² |
| Djibouti | 1,210,220 tn | 1.48 tn | 56 tons/km² |
| 2013 CO2 emissions (tonnes/year) | 67,280 tn |
| 2013 CO2 emissions (tonnes/year) per capita | 1.49 tn |
| 2013 CO2 emissions intensity (tonnes/km²/year) | 28.3 tons/km² |
Natural Hazards Risk
Relative risk out of 10
| Hazard | Risk Level |
|---|---|
| Drought | High (9) |
| Flood | Medium (4) |
| Earthquake | Medium (3.7) |
* Risk, particularly concerning flood or landslide, may not be for the entire area.
- Dilley, M., R.S. Chen, U. Deichmann, A.L. Lerner-Lam, M. Arnold, J. Agwe, P. Buys, O. Kjekstad, B. Lyon, and G. Yetman. 2005. Natural Disaster Hotspots: A Global Risk Analysis. Washington, D.C.: World Bank. https://doi.org/10.1596/0-8213-5930-4.
- Center for Hazards and Risk Research - CHRR - Columbia University, Center for International Earth Science Information Network - CIESIN - Columbia University, and International Research Institute for Climate and Society - IRI - Columbia University. 2005. Global Drought Hazard Frequency and Distribution. Palisades, NY: NASA Socioeconomic Data and Applications Center (SEDAC). https://doi.org/10.7927/H4VX0DFT.
- Center for Hazards and Risk Research - CHRR - Columbia University, Center for International Earth Science Information Network - CIESIN - Columbia University. 2005. Global Flood Hazard Frequency and Distribution. Palisades, NY: NASA Socioeconomic Data and Applications Center (SEDAC). https://doi.org/10.7927/H4668B3D.
- Center for Hazards and Risk Research - CHRR - Columbia University, Center for International Earth Science Information Network - CIESIN - Columbia University. 2005. Global Earthquake Hazard Distribution - Peak Ground Acceleration. Palisades, NY: NASA Socioeconomic Data and Applications Center (SEDAC). https://doi.org/10.7927/H4BZ63ZS.
Recent Nearby Earthquakes
Magnitude 3.0 and greater
| Date▼ | Time↕ | Magnitude↕ | Distance↕ | Depth↕ | Location↕ | Link |
|---|---|---|---|---|---|---|
| 4/14/17 | 10:44 AM | 4.7 | 15.9 km | 10,000 m | 15km SSW of Obock, Djibouti | usgs.gov |
| 4/14/17 | 5:53 AM | 4.7 | 21.3 km | 2,350 m | 21km SSE of Obock, Djibouti | usgs.gov |
| 9/29/15 | 5:31 AM | 4.6 | 43.9 km | 5,910 m | 13km NNE of Loyada, Djibouti | usgs.gov |
| 5/30/15 | 6:48 AM | 4.7 | 33.6 km | 7,280 m | 11km N of Djibouti, Djibouti | usgs.gov |
| 9/8/12 | 9:11 PM | 4.4 | 27.8 km | 10,000 m | Golfe de Tadjoura, Djibouti | usgs.gov |
| 11/23/10 | 2:31 PM | 4.4 | 43.3 km | 10,000 m | Djibouti region | usgs.gov |
| 11/17/10 | 1:45 AM | 4.2 | 33.2 km | 10,000 m | near the coast of Yemen | usgs.gov |
| 11/15/10 | 11:12 AM | 4.6 | 29.3 km | 10,000 m | Djibouti region | usgs.gov |
| 11/15/10 | 3:44 AM | 4.5 | 42.4 km | 10,000 m | Djibouti region | usgs.gov |
| 11/14/10 | 10:22 PM | 5.3 | 31.8 km | 10,000 m | Djibouti region | usgs.gov |
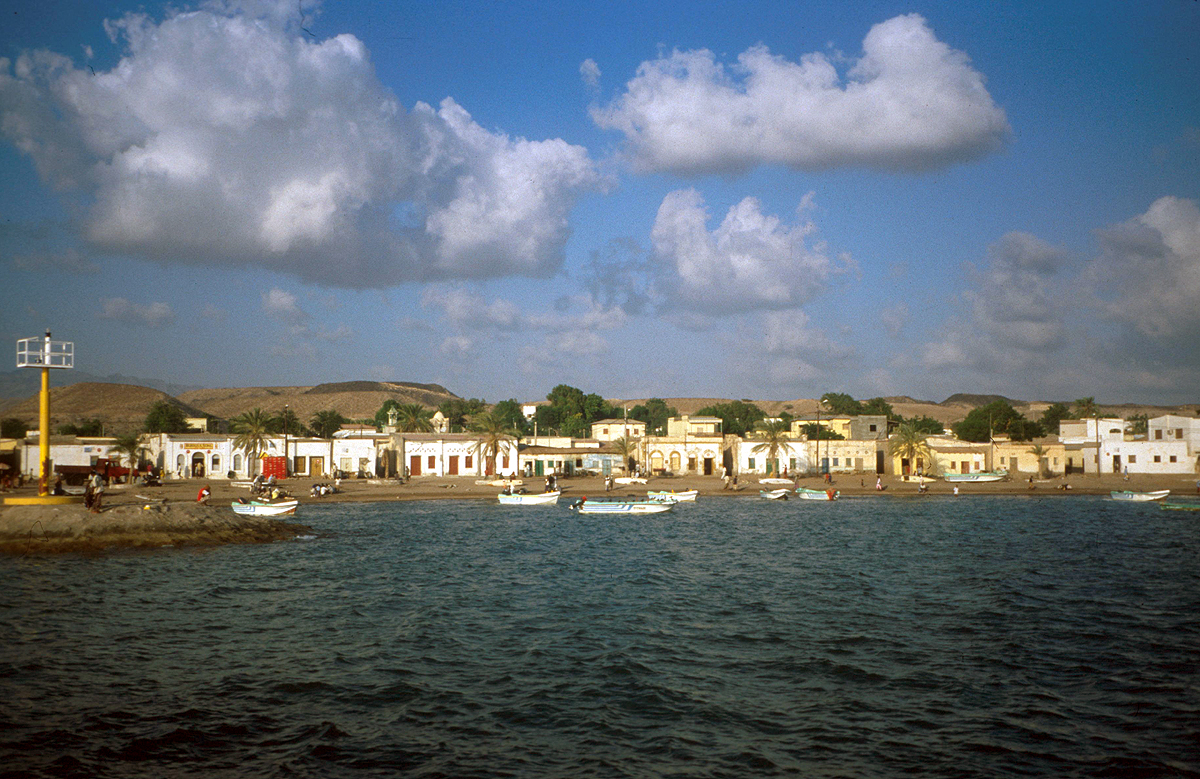
Obock
(also Obok, Ubuk) is a small port town in Djibouti. It is located on the northern shore of the Gulf of Tadjoura, where it opens out into the Gulf of Aden. The town is home to an airstrip and has ferries to Djibouti City, while mangroves lie nearby...
Obock Wikipedia Page


About Our Data
The data on this page is estimated using a number of publicly available tools and resources. It is provided without warranty, and could contain inaccuracies. Use at your own risk.