Industries
Business Distribution by Industry in Guldborg
| Industry Description | Number of Establishments |
|---|---|
| Construction of buildings | 19 |
| Shopping other | 14 |
| Shopping | 8 |
| Technical construction services | 8 |
| Restaurants | 8 |
| Landscaping | 7 |
| Sports and recreation | 7 |
| General cleaning services | 6 |
| All membership organizations | 6 |
| Electrical installation | 6 |
Guldborg Facts
| Area | 0.6 km² |
| Population | 196 |
| Male Population | 102 (51.8%) |
| Female Population | 94 (48.2%) |
| Population change (1975 to 2020) | -29.5% |
| Population change (2000 to 2020) | -14.8% |
| Median Age | 49.6 years (Male: 49.2, Female: 50.1) |
| Local Time | |
| Timezone | Central European Summer Time |
| Lat & Lng | 54.86786, 11.73921 |
| Postal Codes | 4862 |
Map of Guldborg
Interactive Map
Guldborg Population
Years 1975 to 2020
| Data | 1975 | 1990 | 2000 | 2015 | 2020 |
|---|---|---|---|---|---|
| Population | 278 | 263 | 230 | 195 | 196 |
| Population Density | 494.2 / km² | 467.6 / km² | 408.9 / km² | 346.7 / km² | 348.4 / km² |
Guldborg Population change from 2000 to 2015
Decrease of 15.2% from year 2000 to 2015
| Location | Change since 1975 | Change since 1990 | Change since 2000 |
|---|---|---|---|
| Guldborg | -29.9% | -25.9% | -15.2% |
| Region Zealand | +2.2% | +1.7% | +0.6% |
| Denmark | +12.1% | +10.4% | +6.3% |
Guldborg Median Age
Median Age: 49.6 years
| Location | Median Age | Median Age (Female) | Median Age (Male) |
|---|---|---|---|
| Guldborg | 49.6 yrs | 50.1 yrs | 49.2 yrs |
| Region Zealand | 42.9 yrs | 43.7 yrs | 42.2 yrs |
| Denmark | 40.5 yrs | 41.3 yrs | 39.6 yrs |
Guldborg Population Density
Population Density: 348 / km²
| Location | Population | Area | Density |
|---|---|---|---|
| Guldborg | 196 | 0.563 km² | 348 / km² |
| Region Zealand | 802,458 | 7,343.5 km² | 109 / km² |
| Denmark | 5.5 million | 43,072 km² | 129 / km² |
Guldborg Historical and Projected Population
Estimated Population from 0 to 2100
- JRC (European Commission's Joint Research Centre) work on the GHS built-up grid
- CIESIN (Center for International Earth Science Information Network)
- [Link] Klein Goldewijk, K., Beusen, A., Doelman, J., and Stehfest, E.: Anthropogenic land use estimates for the Holocene – HYDE 3.2, Earth Syst. Sci. Data, 9, 927–953, https://doi.org/10.5194/essd-9-927-2017, 2017.
Human Development Index (HDI)
Statistic composite index of life expectancy, education, and per capita income.
Region Zealand CO2 Emissions
Carbon Dioxide (CO2) Emissions Per Capita in Tonnes Per Year
| Location | CO2 Emissions | CO2 Emissions Per Capita | CO2 Emissions Intensity |
|---|---|---|---|
| Region Zealand | 8,459,301 tn | 10.54 tn | 1,151.9 tons/km² |
| Denmark | 59,647,725 tn | 10.75 tn | 1,384.8 tons/km² |
| 2013 CO2 emissions (tonnes/year) | 8,459,301 tn |
| 2013 CO2 emissions (tonnes/year) per capita | 10.54 tn |
| 2013 CO2 emissions intensity (tonnes/km²/year) | 1,151.9 tons/km² |
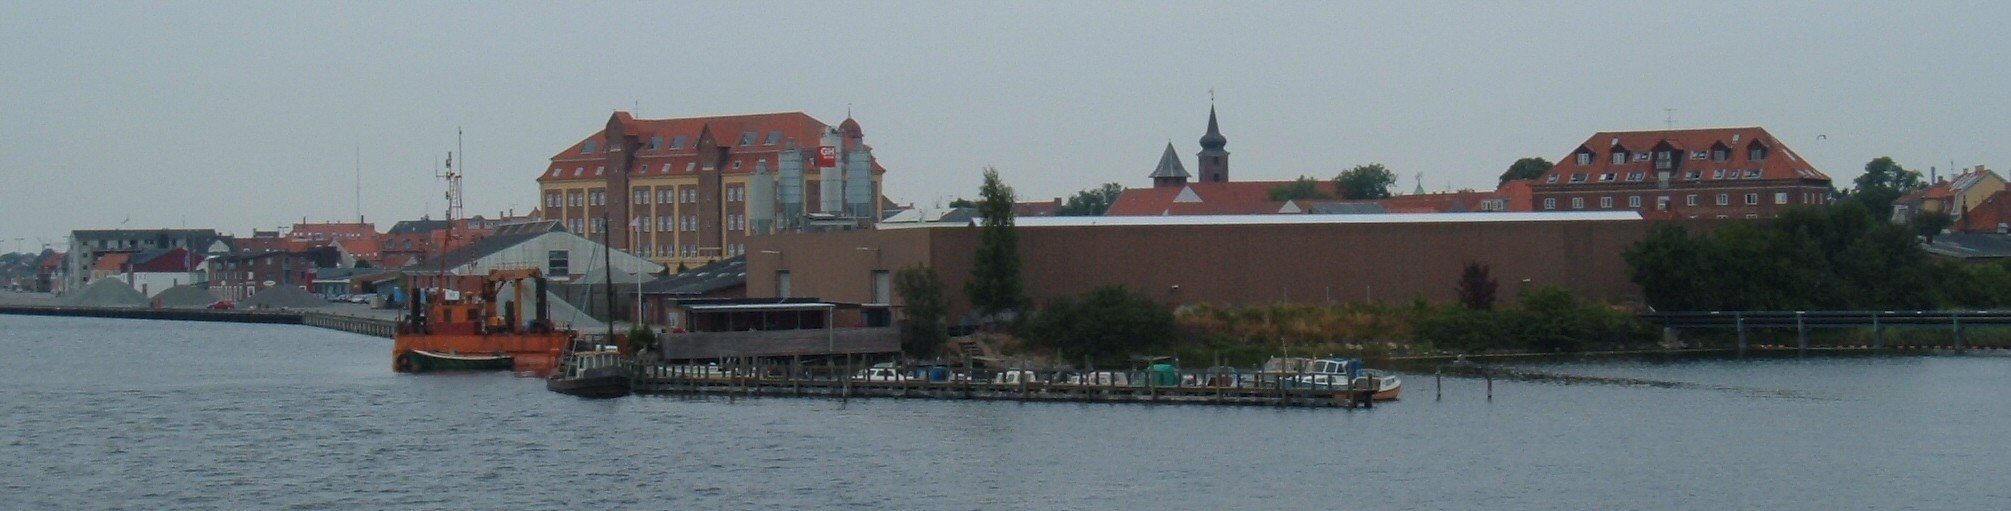
Guldborg
Guldborg is a fishing village spanning the islands of Falster and Lolland in Denmark. It belongs to Guldborgsund Municipality, in Region Zealand. In 2015 the village had a population of 533, with about 500 living on the Lolland side. The village is ..
Guldborg Wikipedia Page


About Our Data
The data on this page is estimated using a number of publicly available tools and resources. It is provided without warranty, and could contain inaccuracies. Use at your own risk.