Categories in Havdrup
Industries
Business Distribution by Industry in Havdrup
| Industry Description | Number of Establishments | Average Google Rating |
|---|---|---|
| Shopping | 34 | 4.4 |
| Unreachable | 22 | 4.5 |
| Rental equipment | 19 | 4.1 |
| General contractors | 17 | 4.5 |
| Other construction | 14 | 3.3 |
| Technical construction services | 14 | 4.5 |
| Car repair | 12 | 4.7 |
| Corporate management | 12 | 4.9 |
| Wholesale of machinery | 11 | 3.9 |
| Heating installation and repair | 10 | 3.3 |
| Stock brokers | 10 | — |
| Landscaping | 10 | 4.4 |
| Painting and paint contractors | 8 | 5 |
| Holding companies | 8 | — |
| Plumbing installation and repair | 8 | 3.8 |
| Education | 7 | 4.3 |
| Wholesale of construction supplies | 7 | 4.3 |
| Nurseries and garden supplies | 7 | 4.6 |
| Construction of buildings | 7 | 5 |
| Other membership organizations | 7 | 4.5 |
| Kitchen and bath cabinets and remodel | 6 | — |
| Automotive | 6 | 4.2 |
| New car dealers | 6 | 4.4 |
| Post office | 6 | 5 |
| Shopping other | 6 | 4.3 |
Havdrup Facts
| Area | 2.2 km² |
| Population | 3,623 |
| Male Population | 1,810 (50.0%) |
| Female Population | 1,813 (50.0%) |
| Population change (1975 to 2020) | +14.9% |
| Population change (2000 to 2020) | +4.0% |
| Median Age | 40.5 years (Male: 40.3, Female: 40.6) |
| Neighborhoods | Indre By, Vestegnen, Vanløse, Nørrebro |
| Local Time | |
| Timezone | Central European Summer Time |
| Lat & Lng | 55.54481, 12.12392 |
| Postal Codes | 4622 |
Map of Havdrup
Interactive Map
Havdrup Population
Years 1975 to 2020
| Data | 1975 | 1990 | 2000 | 2015 | 2020 |
|---|---|---|---|---|---|
| Population | 3,153 | 3,426 | 3,483 | 3,517 | 3,623 |
| Population Density | 1,441.4 / km² | 1,566.2 / km² | 1,592.2 / km² | 1,607.8 / km² | 1,656.2 / km² |
Havdrup Population change from 2000 to 2015
Increase of 1% from year 2000 to 2015
| Location | Change since 1975 | Change since 1990 | Change since 2000 |
|---|---|---|---|
| Havdrup | +11.5% | +2.7% | +1% |
| Region Zealand | +2.2% | +1.7% | +0.6% |
| Denmark | +12.1% | +10.4% | +6.3% |
Havdrup Median Age
Median Age: 40.5 years
| Location | Median Age | Median Age (Female) | Median Age (Male) |
|---|---|---|---|
| Havdrup | 40.5 yrs | 40.6 yrs | 40.3 yrs |
| Region Zealand | 42.9 yrs | 43.7 yrs | 42.2 yrs |
| Denmark | 40.5 yrs | 41.3 yrs | 39.6 yrs |
Havdrup Population Density
Population Density: 1,656 / km²
| Location | Population | Area | Density |
|---|---|---|---|
| Havdrup | 3,623 | 2.188 km² | 1,656 / km² |
| Region Zealand | 802,458 | 7,343.5 km² | 109 / km² |
| Denmark | 5.5 million | 43,072 km² | 129 / km² |
Havdrup Historical and Projected Population
Estimated Population from 0 to 2100
- JRC (European Commission's Joint Research Centre) work on the GHS built-up grid
- CIESIN (Center for International Earth Science Information Network)
- [Link] Klein Goldewijk, K., Beusen, A., Doelman, J., and Stehfest, E.: Anthropogenic land use estimates for the Holocene – HYDE 3.2, Earth Syst. Sci. Data, 9, 927–953, https://doi.org/10.5194/essd-9-927-2017, 2017.
Price Distribution
Business distribution by price for Havdrup
Human Development Index (HDI)
Statistic composite index of life expectancy, education, and per capita income.
Havdrup CO2 Emissions
Carbon Dioxide (CO2) Emissions Per Capita in Tonnes Per Year
| Location | CO2 Emissions | CO2 Emissions Per Capita | CO2 Emissions Intensity |
|---|---|---|---|
| Havdrup | 41,946 tn | 11.58 tn | 19,175.2 tons/km² |
| Region Zealand | 8,459,301 tn | 10.54 tn | 1,151.9 tons/km² |
| Denmark | 59,647,725 tn | 10.75 tn | 1,384.8 tons/km² |
| 2013 CO2 emissions (tonnes/year) | 41,946 tn |
| 2013 CO2 emissions (tonnes/year) per capita | 11.58 tn |
| 2013 CO2 emissions intensity (tonnes/km²/year) | 19,175.2 tons/km² |
Recent Nearby Earthquakes
Magnitude 3.0 and greater
| Date▼ | Time↕ | Magnitude↕ | Distance↕ | Depth↕ | Location↕ | Link |
|---|---|---|---|---|---|---|
| 12/16/08 | 5:20 AM | 4.3 | 81.3 km | 10,000 m | Sweden | usgs.gov |
| 2/3/05 | 5:49 PM | 3 | 80.6 km | 0 m | Denmark | usgs.gov |
| 2/3/05 | 3:49 PM | 3 | 88.2 km | 100 m | Denmark | usgs.gov |
| 4/1/86 | 9:56 AM | 4.2 | 97.7 km | 33,000 m | Sweden | usgs.gov |
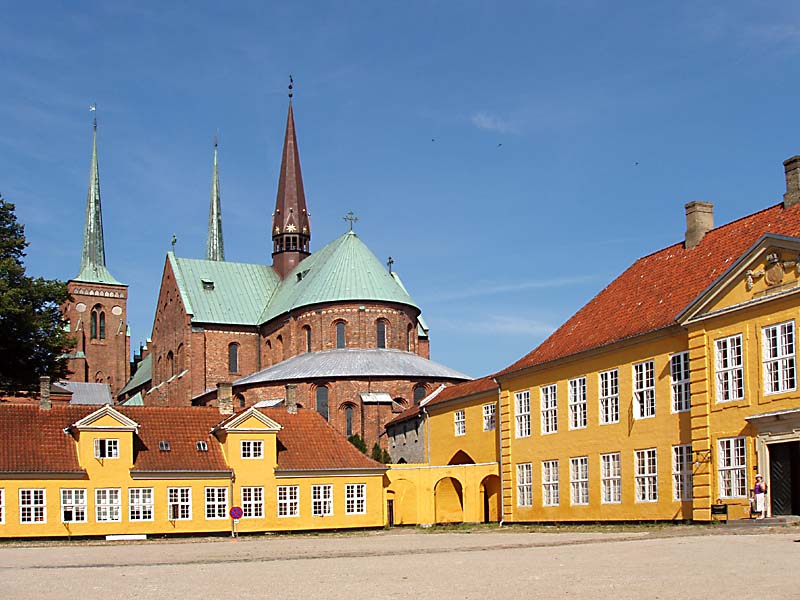
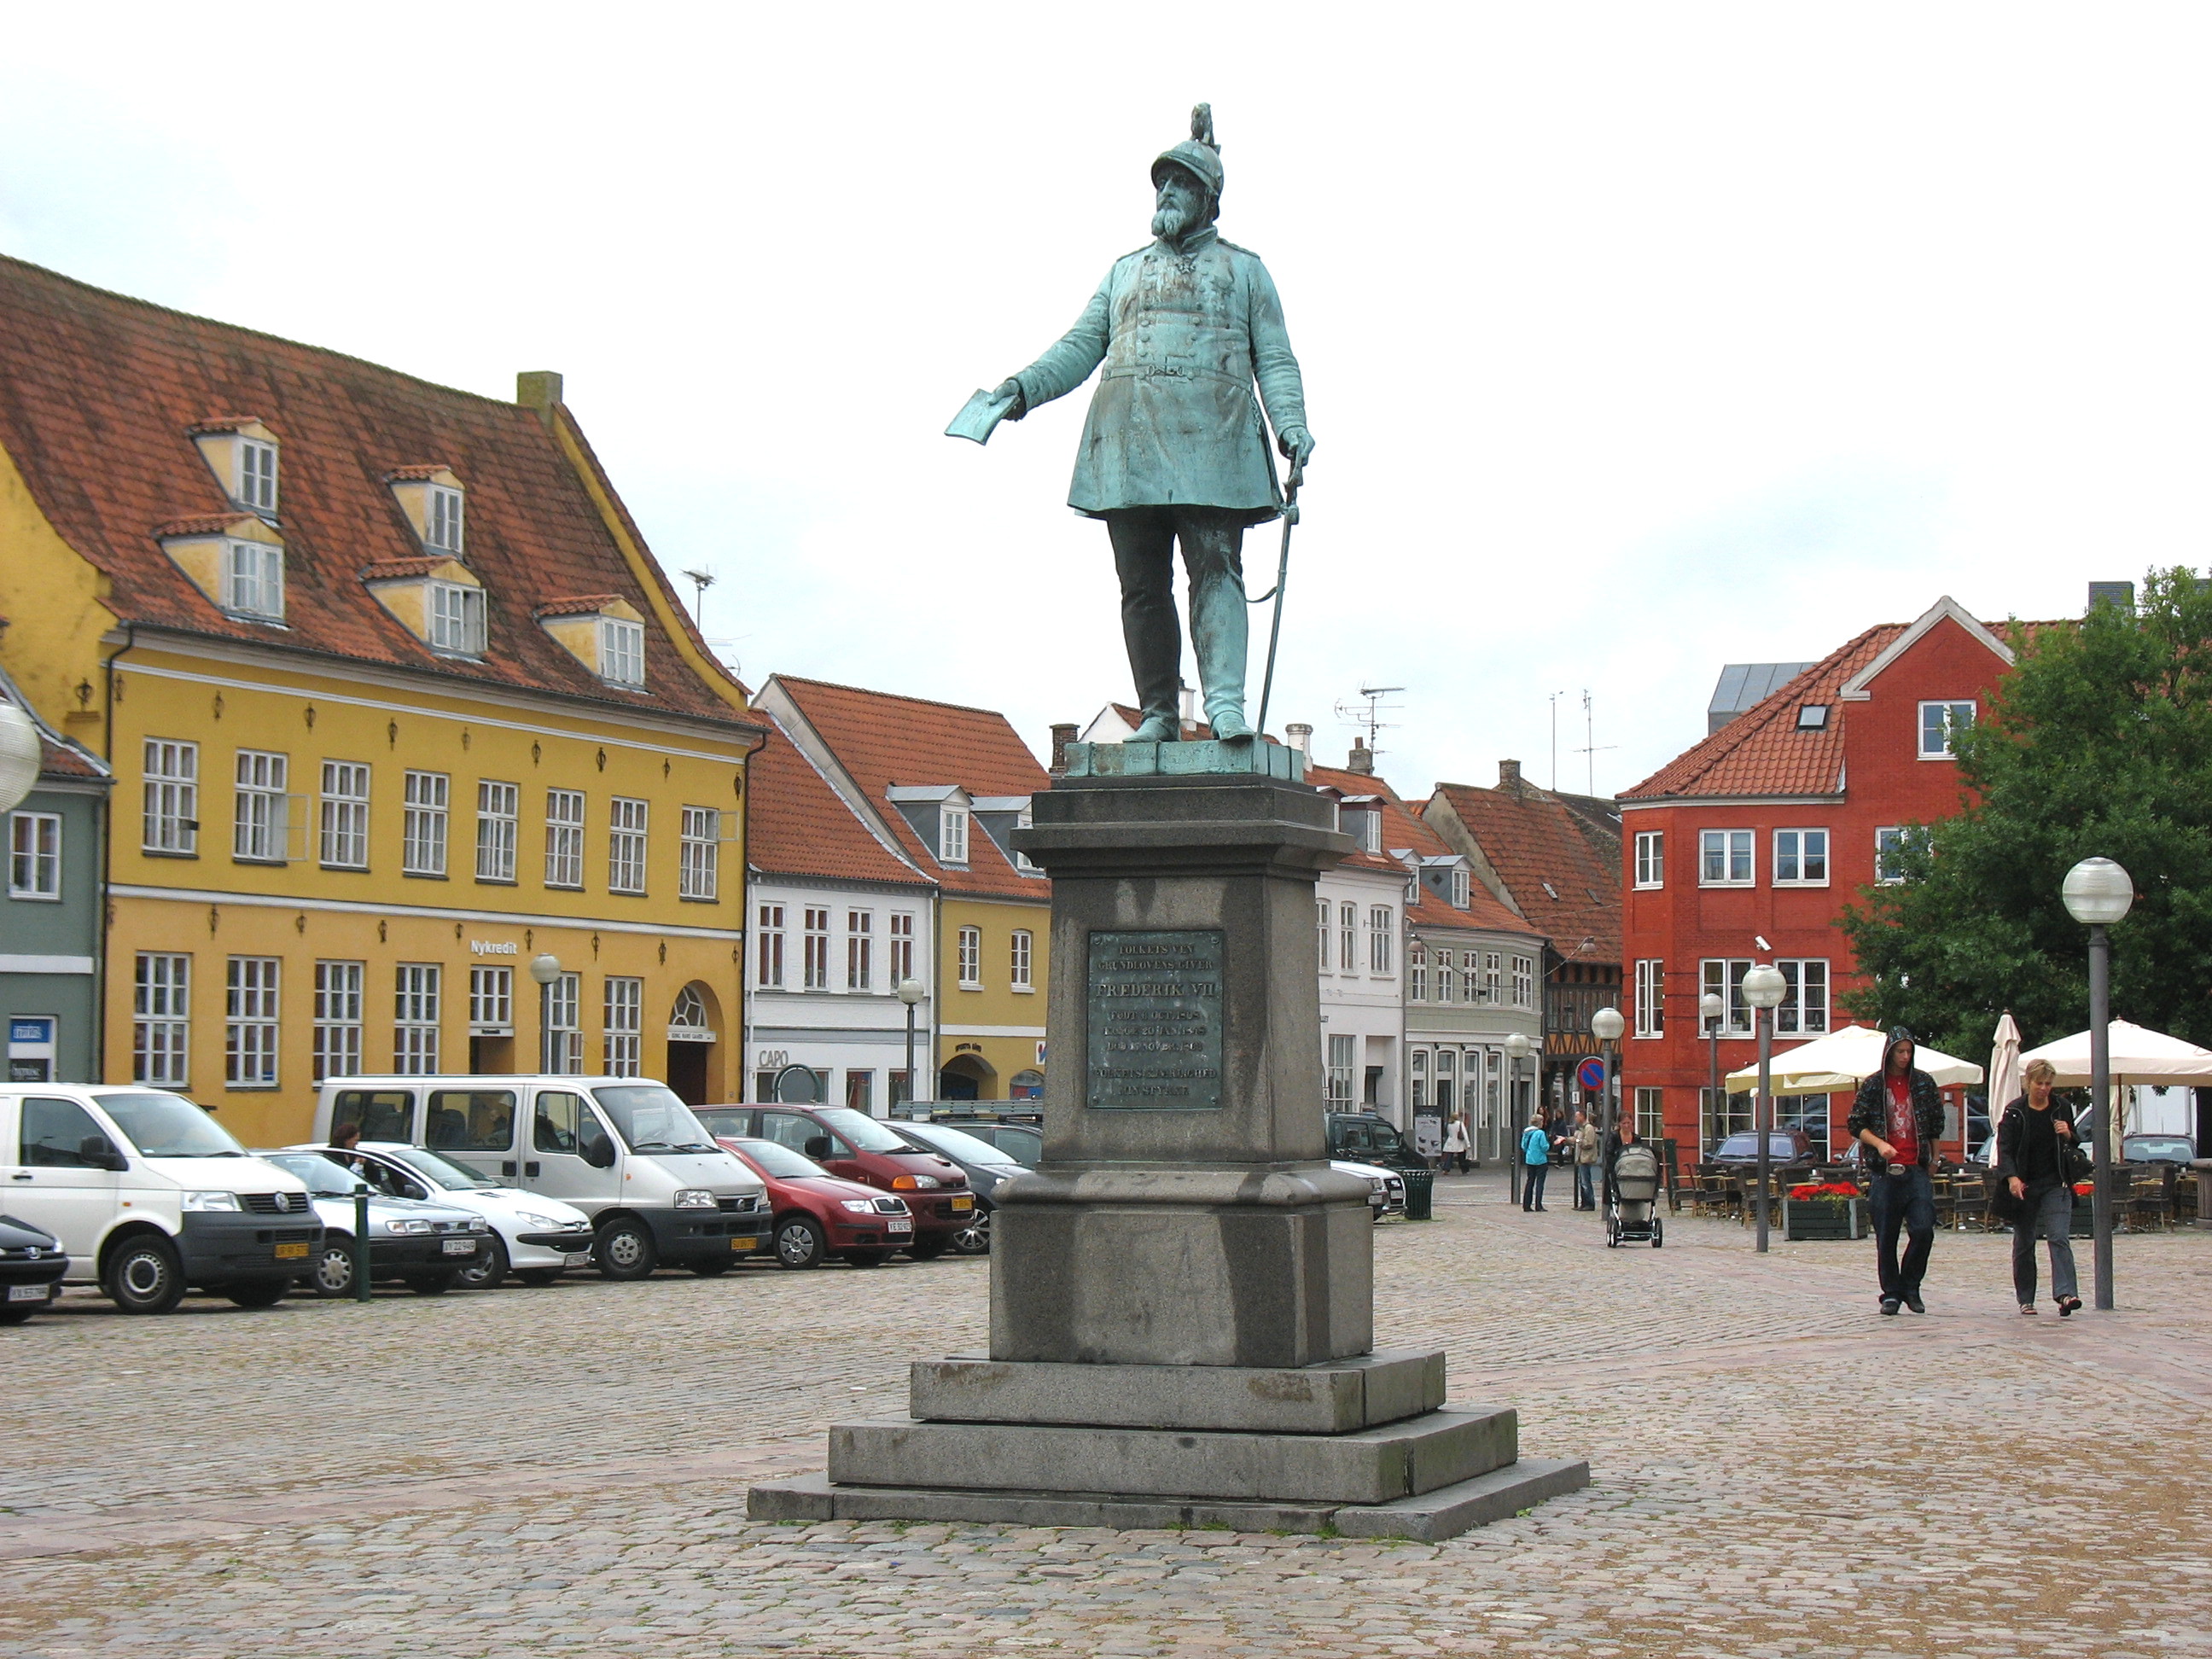
Havdrup
Havdrup is a small town straddling the boundary between Solrød and Roskilde municipalities, some 30 km southwest of Copenhagen, Denmark. Havdrup station serves the Little South railway line between Roskilde and Køge. Havdrup had a population of 3,972..
Havdrup Wikipedia Page

About Our Data
The data on this page is estimated using a number of publicly available tools and resources. It is provided without warranty, and could contain inaccuracies. Use at your own risk.