Industries
Business Distribution by Industry in Horbelev
| Industry Description | Number of Establishments |
|---|---|
| Construction of buildings | 22 |
| Shopping | 13 |
| Unreachable | 12 |
| Beauty salons | 10 |
| Shopping other | 9 |
| General cleaning services | 8 |
| Landscaping | 8 |
| Education | 7 |
| Kitchen and bath cabinets and remodel | 7 |
Horbelev Facts
| Area | 0.7 km² |
| Population | 256 |
| Population change (1975 to 2020) | -46.1% |
| Population change (2000 to 2020) | -27.3% |
| Local Time | |
| Timezone | Central European Summer Time |
| Lat & Lng | 54.82303, 12.05838 |
| Postal Codes | 4871 |
Map of Horbelev
Interactive Map
Horbelev Population
Years 1975 to 2020
| Data | 1975 | 1990 | 2000 | 2015 | 2020 |
|---|---|---|---|---|---|
| Population | 475 | 427 | 352 | 254 | 256 |
| Population Density | 690.9 / km² | 621.1 / km² | 512 / km² | 369.5 / km² | 372.4 / km² |
Horbelev Population change from 2000 to 2015
Decrease of 27.8% from year 2000 to 2015
| Location | Change since 1975 | Change since 1990 | Change since 2000 |
|---|---|---|---|
| Horbelev | -46.5% | -40.5% | -27.8% |
| Region Zealand | +2.2% | +1.7% | +0.6% |
| Denmark | +12.1% | +10.4% | +6.3% |
Horbelev Population Density
Population Density: 372 / km²
| Location | Population | Area | Density |
|---|---|---|---|
| Horbelev | 256 | 0.688 km² | 372 / km² |
| Region Zealand | 802,458 | 7,343.5 km² | 109 / km² |
| Denmark | 5.5 million | 43,072 km² | 129 / km² |
Horbelev Historical and Projected Population
Estimated Population from 0 to 2100
- JRC (European Commission's Joint Research Centre) work on the GHS built-up grid
- CIESIN (Center for International Earth Science Information Network)
- [Link] Klein Goldewijk, K., Beusen, A., Doelman, J., and Stehfest, E.: Anthropogenic land use estimates for the Holocene – HYDE 3.2, Earth Syst. Sci. Data, 9, 927–953, https://doi.org/10.5194/essd-9-927-2017, 2017.
Human Development Index (HDI)
Statistic composite index of life expectancy, education, and per capita income.
Horbelev CO2 Emissions
Carbon Dioxide (CO2) Emissions Per Capita in Tonnes Per Year
| Location | CO2 Emissions | CO2 Emissions Per Capita | CO2 Emissions Intensity |
|---|---|---|---|
| Horbelev | 2,774 tn | 10.83 tn | 4,034.5 tons/km² |
| Region Zealand | 8,459,301 tn | 10.54 tn | 1,151.9 tons/km² |
| Denmark | 59,647,725 tn | 10.75 tn | 1,384.8 tons/km² |
| 2013 CO2 emissions (tonnes/year) | 2,774 tn |
| 2013 CO2 emissions (tonnes/year) per capita | 10.83 tn |
| 2013 CO2 emissions intensity (tonnes/km²/year) | 4,034.5 tons/km² |
Recent Nearby Earthquakes
Magnitude 3.0 and greater
| Date▼ | Time↕ | Magnitude↕ | Distance↕ | Depth↕ | Location↕ | Link |
|---|---|---|---|---|---|---|
| 7/21/01 | 4:35 PM | 3.5 | 96 km | 10,000 m | Germany | usgs.gov |
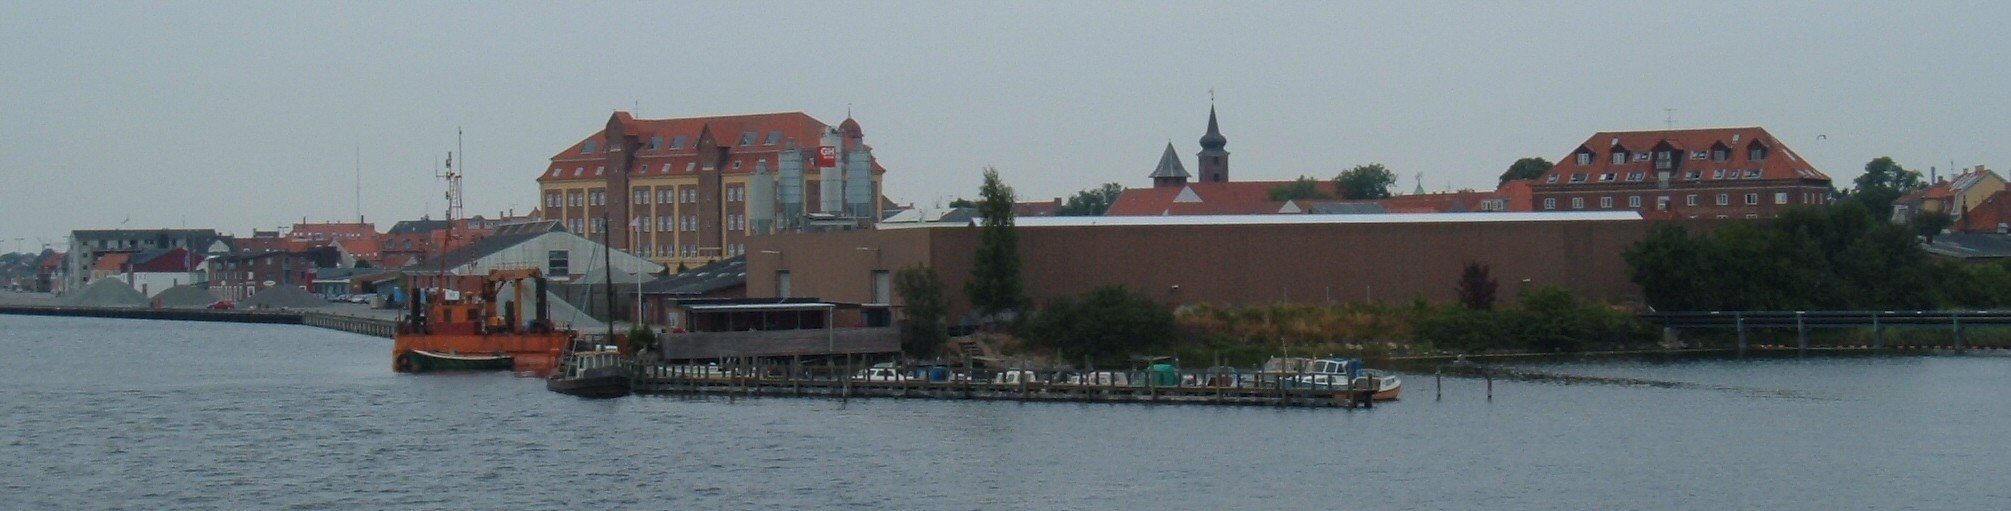
Horbelev
Horbelev is a village some 16 kilometres (9.9 mi) northeast of Nykøbing on the Danish island of Falster. Horbelev Church, one of Falster's oldest, dates from the beginning of the 13th century. In January 2015 Horbelev had a population of 583.
Horbelev Wikipedia Page


About Our Data
The data on this page is estimated using a number of publicly available tools and resources. It is provided without warranty, and could contain inaccuracies. Use at your own risk.