Categories in Marstal
Industries
Business Distribution by Industry in Marstal
| Industry Description | Number of Establishments | Average Google Rating |
|---|---|---|
| Shopping | 21 | 4.3 |
| Restaurants | 19 | 3.8 |
| Other membership organizations | 15 | — |
| All membership organizations | 14 | 4.7 |
| Other accommodation | 10 | 4.2 |
| Bars, pubs and taverns | 8 | 4.2 |
| Education | 8 | 4.3 |
| General contractors | 7 | 4 |
| All food and beverage | 6 | 4.3 |
| Museums | 5 | 4.5 |
| Passenger boats | 5 | — |
| Cafes | 5 | 3.9 |
| Sports and recreation | 5 | 4.4 |
| Sporting goods | 5 | 4.8 |
Marstal Facts
| Area | 1.0 km² |
| Population | 1,611 |
| Male Population | 809 (50.2%) |
| Female Population | 802 (49.8%) |
| Population change (1975 to 2020) | -44.8% |
| Population change (2000 to 2020) | -23.6% |
| Median Age | 52.4 years (Male: 50.5, Female: 54.6) |
| Local Time | |
| Timezone | Central European Summer Time |
| Lat & Lng | 54.85621, 10.51726 |
| Postal Codes | 5960 |
Map of Marstal
Interactive Map
Marstal Population
Years 1975 to 2020
| Data | 1975 | 1990 | 2000 | 2015 | 2020 |
|---|---|---|---|---|---|
| Population | 2,921 | 2,438 | 2,109 | 1,642 | 1,611 |
| Population Density | 2,921 / km² | 2,438 / km² | 2,109 / km² | 1,642 / km² | 1,611 / km² |
Marstal Population change from 2000 to 2015
Decrease of 22.1% from year 2000 to 2015
| Location | Change since 1975 | Change since 1990 | Change since 2000 |
|---|---|---|---|
| Marstal | -43.8% | -32.6% | -22.1% |
| Region of Southern Denmark | +4.3% | +4.1% | +2.2% |
| Denmark | +12.1% | +10.4% | +6.3% |
Marstal Median Age
Median Age: 52.4 years
| Location | Median Age | Median Age (Female) | Median Age (Male) |
|---|---|---|---|
| Marstal | 52.4 yrs | 54.6 yrs | 50.5 yrs |
| Region of Southern Denmark | 41.6 yrs | 42.4 yrs | 40.8 yrs |
| Denmark | 40.5 yrs | 41.3 yrs | 39.6 yrs |
Marstal Population Density
Population Density: 1,611 / km²
| Location | Population | Area | Density |
|---|---|---|---|
| Marstal | 1,611 | 1 km² | 1,611 / km² |
| Region of Southern Denmark | 1.2 million | 12,185.6 km² | 97.6 / km² |
| Denmark | 5.5 million | 43,072 km² | 129 / km² |
Marstal Historical and Projected Population
Estimated Population from 0 to 2100
- JRC (European Commission's Joint Research Centre) work on the GHS built-up grid
- CIESIN (Center for International Earth Science Information Network)
- [Link] Klein Goldewijk, K., Beusen, A., Doelman, J., and Stehfest, E.: Anthropogenic land use estimates for the Holocene – HYDE 3.2, Earth Syst. Sci. Data, 9, 927–953, https://doi.org/10.5194/essd-9-927-2017, 2017.
Price Distribution
Business distribution by price for Marstal
Human Development Index (HDI)
Statistic composite index of life expectancy, education, and per capita income.
Marstal CO2 Emissions
Carbon Dioxide (CO2) Emissions Per Capita in Tonnes Per Year
| Location | CO2 Emissions | CO2 Emissions Per Capita | CO2 Emissions Intensity |
|---|---|---|---|
| Marstal | 18,121 tn | 11.25 tn | 18,120.9 tons/km² |
| Region of Southern Denmark | 13,078,559 tn | 11 tn | 1,073.3 tons/km² |
| Denmark | 59,647,725 tn | 10.75 tn | 1,384.8 tons/km² |
| 2013 CO2 emissions (tonnes/year) | 18,121 tn |
| 2013 CO2 emissions (tonnes/year) per capita | 11.25 tn |
| 2013 CO2 emissions intensity (tonnes/km²/year) | 18,120.9 tons/km² |
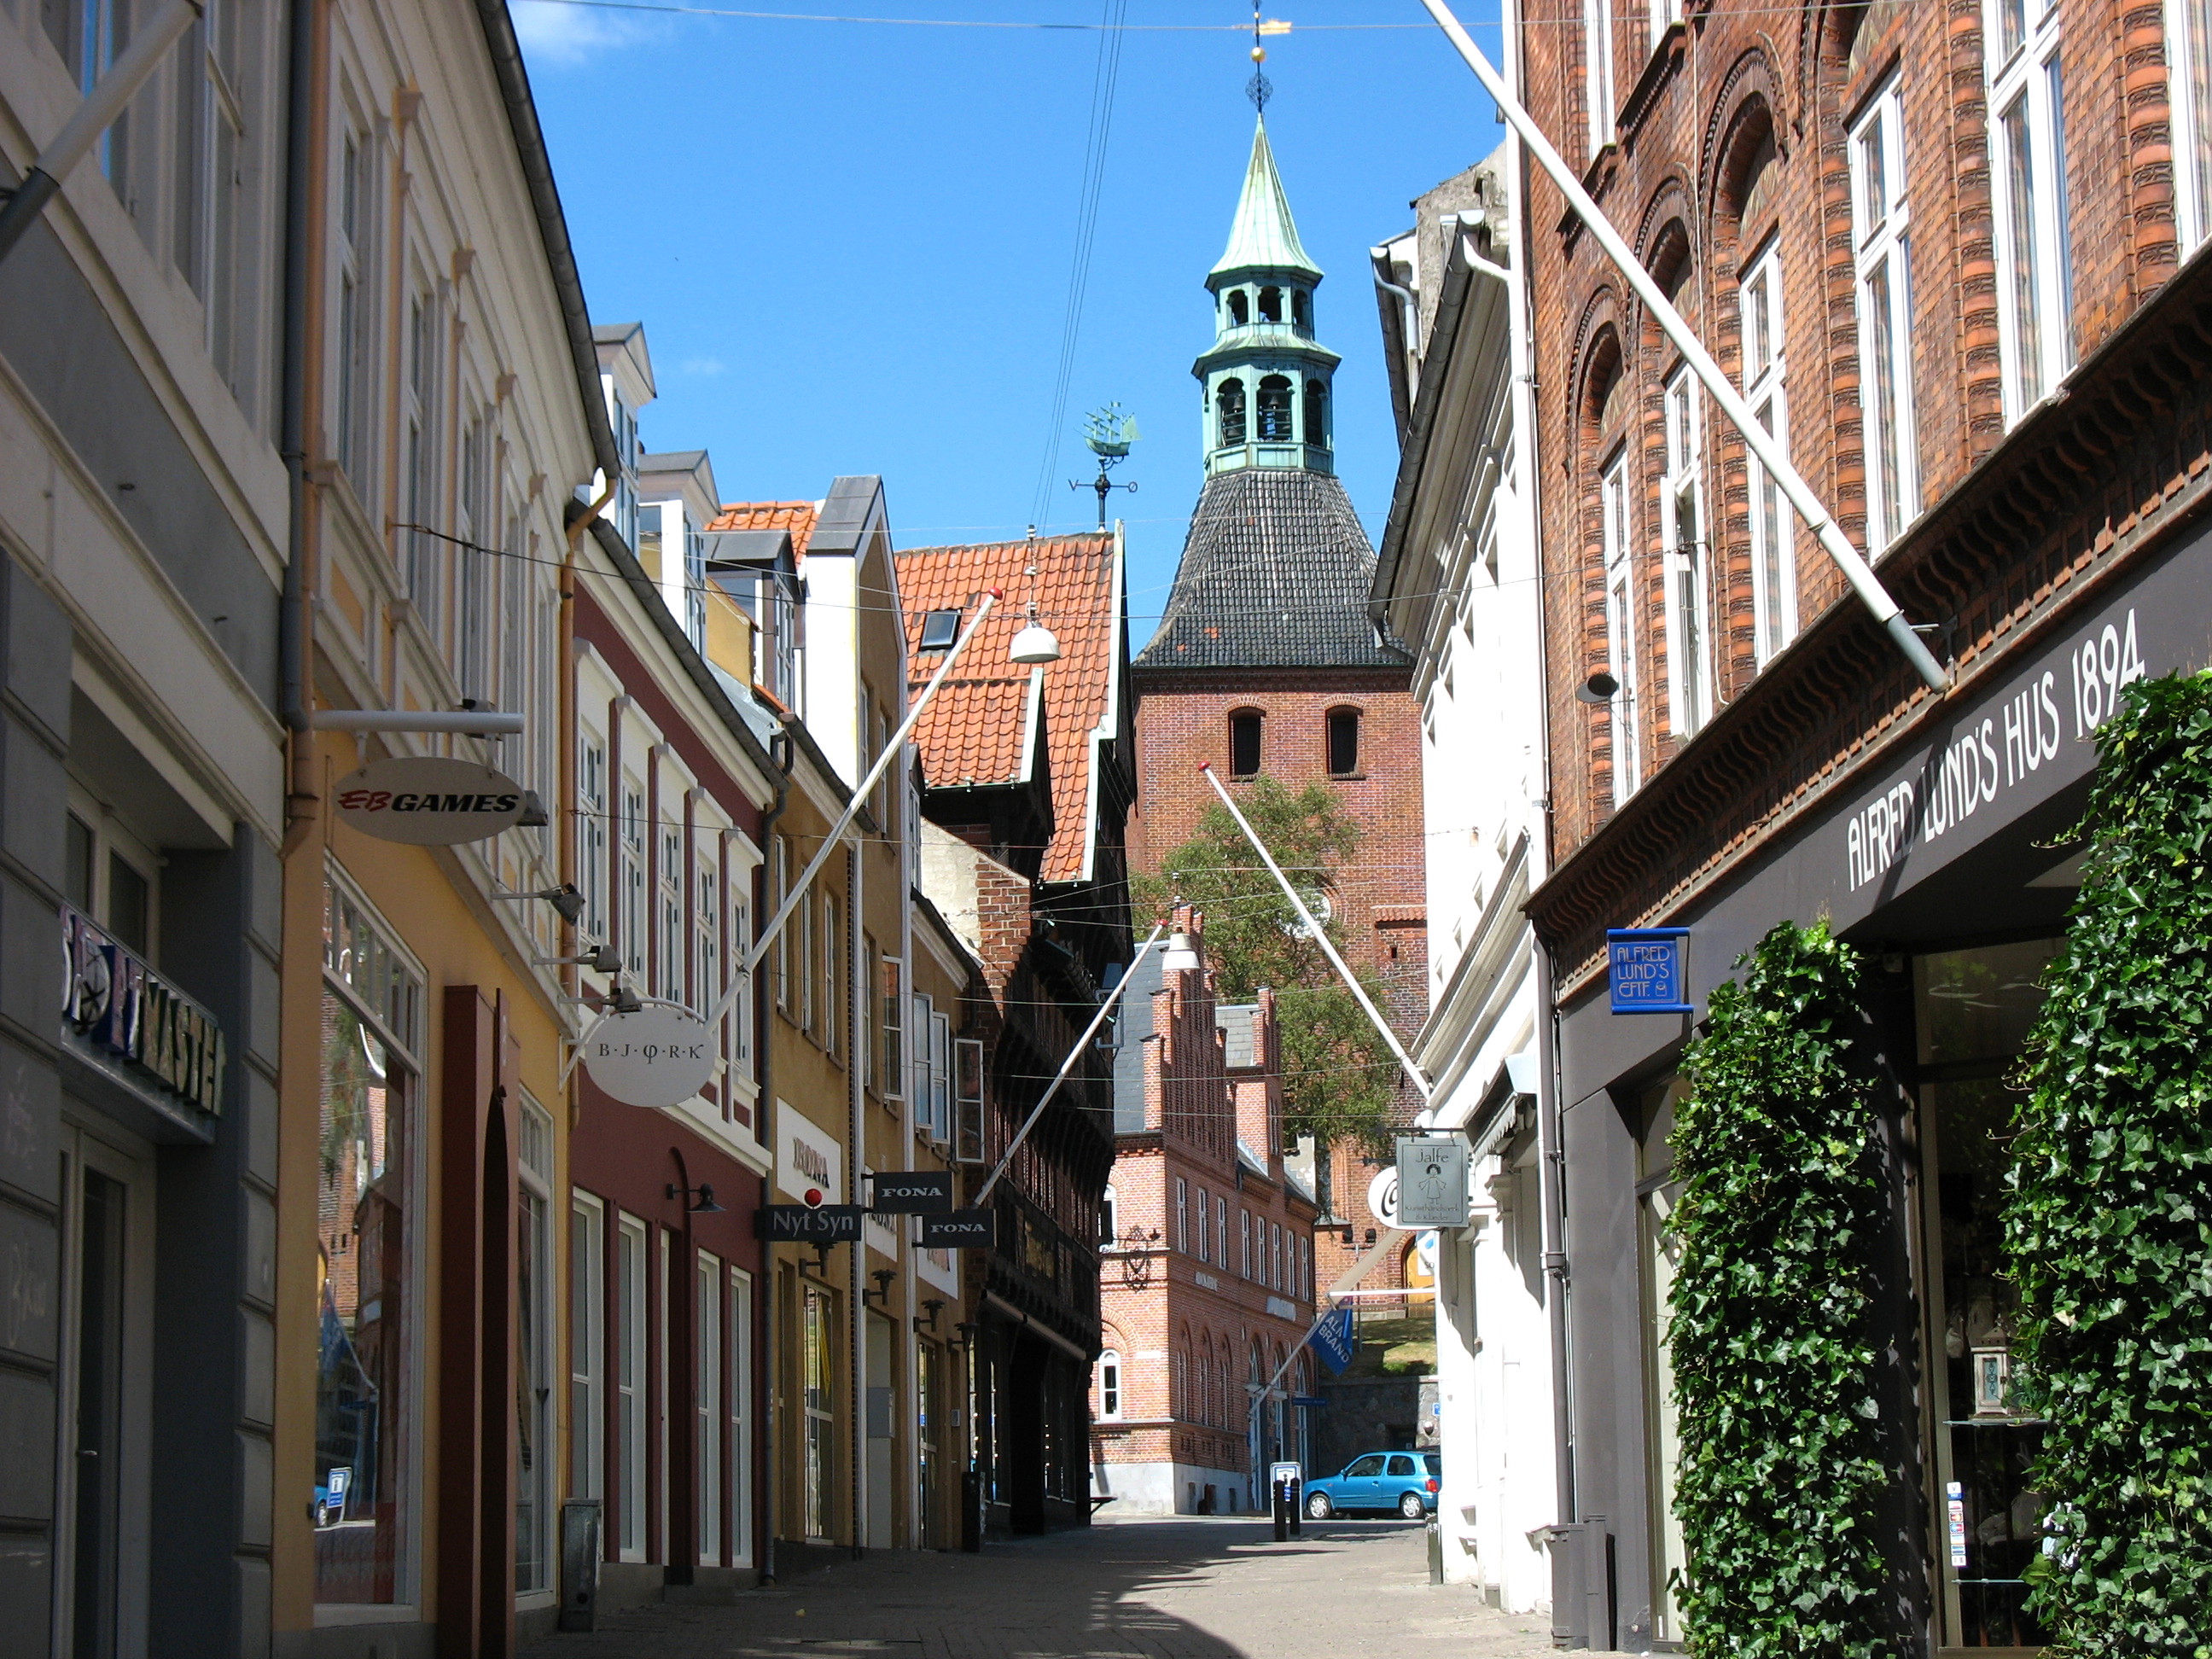
Marstal
is a town in southern Denmark, located in Ærø municipality on the island of Ærø. Marstal has a population of 2,306 (1 January 2014) and is the largest town on Ærø. It was in the abolished Marstal Municipality. has a long maritime history. For cent..
Marstal Wikipedia Page


About Our Data
The data on this page is estimated using a number of publicly available tools and resources. It is provided without warranty, and could contain inaccuracies. Use at your own risk.