Categories in Nibe
Industries
Business Distribution by Industry in Nibe
| Industry Description | Number of Establishments | Average Google Rating |
|---|---|---|
| Shopping | 92 | 4.1 |
| Unreachable | 70 | 4.5 |
| Landscaping | 64 | 4.1 |
| Farming | 53 | 4.4 |
| Other membership organizations | 45 | 4.6 |
| All membership organizations | 36 | 4.5 |
| Real estate | 32 | 4 |
| Nurseries and garden supplies | 29 | 4.6 |
| Post office | 29 | 4.7 |
| General contractors | 28 | 4.9 |
| Health and medical | 28 | 4.8 |
| Other construction | 27 | 4.9 |
| Education | 25 | 4.4 |
| Shopping other | 25 | 4 |
| All food and beverage | 23 | 4 |
| Rental equipment | 23 | — |
| Sports and recreation | 22 | 4.4 |
| Sports clubs | 21 | 4.4 |
| Restaurants | 19 | 4.2 |
| Kitchen and bath cabinets and remodel | 19 | 4.9 |
| Churches | 18 | 4.5 |
| Grocery stores and supermarkets | 17 | 4 |
| Technical construction services | 16 | 5 |
| Corporate management | 15 | 3.8 |
Nibe Facts
| Area | 2.6 km² |
| Population | 4,186 |
| Male Population | 2,013 (48.1%) |
| Female Population | 2,173 (51.9%) |
| Population change (1975 to 2020) | +57.0% |
| Population change (2000 to 2020) | +18.4% |
| Median Age | 44.9 years (Male: 43, Female: 46.8) |
| Local Time | |
| Timezone | Central European Summer Time |
| Lat & Lng | 56.98150, 9.63917 |
| Postal Codes | 9240 |
Map of Nibe
Interactive Map
Nibe Population
Years 1975 to 2020
| Data | 1975 | 1990 | 2000 | 2015 | 2020 |
|---|---|---|---|---|---|
| Population | 2,666 | 3,174 | 3,536 | 4,156 | 4,186 |
| Population Density | 1,040.4 / km² | 1,238.6 / km² | 1,379.9 / km² | 1,621.9 / km² | 1,633.6 / km² |
Nibe Population change from 2000 to 2015
Increase of 17.5% from year 2000 to 2015
| Location | Change since 1975 | Change since 1990 | Change since 2000 |
|---|---|---|---|
| Nibe | +55.9% | +30.9% | +17.5% |
| North Denmark Region | +2.1% | +1.3% | +0.3% |
| Denmark | +12.1% | +10.4% | +6.3% |
Nibe Median Age
Median Age: 44.9 years
| Location | Median Age | Median Age (Female) | Median Age (Male) |
|---|---|---|---|
| Nibe | 44.9 yrs | 46.8 yrs | 43 yrs |
| North Denmark Region | 42 yrs | 43 yrs | 41 yrs |
| Denmark | 40.5 yrs | 41.3 yrs | 39.6 yrs |
Nibe Population Density
Population Density: 1,634 / km²
| Location | Population | Area | Density |
|---|---|---|---|
| Nibe | 4,186 | 2.563 km² | 1,634 / km² |
| North Denmark Region | 566,100 | 7,966.1 km² | 71.1 / km² |
| Denmark | 5.5 million | 43,072 km² | 129 / km² |
Nibe Historical and Projected Population
Estimated Population from 1870 to 2100
- JRC (European Commission's Joint Research Centre) work on the GHS built-up grid
- CIESIN (Center for International Earth Science Information Network)
- [Link] Klein Goldewijk, K., Beusen, A., Doelman, J., and Stehfest, E.: Anthropogenic land use estimates for the Holocene – HYDE 3.2, Earth Syst. Sci. Data, 9, 927–953, https://doi.org/10.5194/essd-9-927-2017, 2017.
Price Distribution
Business distribution by price for Nibe
Human Development Index (HDI)
Statistic composite index of life expectancy, education, and per capita income.
Nibe CO2 Emissions
Carbon Dioxide (CO2) Emissions Per Capita in Tonnes Per Year
| Location | CO2 Emissions | CO2 Emissions Per Capita | CO2 Emissions Intensity |
|---|---|---|---|
| Nibe | 47,555 tn | 11.36 tn | 18,558.1 tons/km² |
| North Denmark Region | 6,400,458 tn | 11.31 tn | 803.5 tons/km² |
| Denmark | 59,647,725 tn | 10.75 tn | 1,384.8 tons/km² |
| 2013 CO2 emissions (tonnes/year) | 47,555 tn |
| 2013 CO2 emissions (tonnes/year) per capita | 11.36 tn |
| 2013 CO2 emissions intensity (tonnes/km²/year) | 18,558.1 tons/km² |
Natural Hazards Risk
Relative risk out of 10
| Hazard | Risk Level |
|---|---|
| Drought | Low (2) |
* Risk, particularly concerning flood or landslide, may not be for the entire area.
- Dilley, M., R.S. Chen, U. Deichmann, A.L. Lerner-Lam, M. Arnold, J. Agwe, P. Buys, O. Kjekstad, B. Lyon, and G. Yetman. 2005. Natural Disaster Hotspots: A Global Risk Analysis. Washington, D.C.: World Bank. https://doi.org/10.1596/0-8213-5930-4.
- Center for Hazards and Risk Research - CHRR - Columbia University, Center for International Earth Science Information Network - CIESIN - Columbia University, and International Research Institute for Climate and Society - IRI - Columbia University. 2005. Global Drought Hazard Frequency and Distribution. Palisades, NY: NASA Socioeconomic Data and Applications Center (SEDAC). https://doi.org/10.7927/H4VX0DFT.
Recent Nearby Earthquakes
Magnitude 3.0 and greater
| Date▼ | Time↕ | Magnitude↕ | Distance↕ | Depth↕ | Location↕ | Link |
|---|---|---|---|---|---|---|
| 11/24/04 | 11:25 AM | 3.1 | 99.7 km | 15,000 m | Denmark | usgs.gov |
| 5/30/95 | 4:00 AM | 3.2 | 88.6 km | 10,000 m | Denmark | usgs.gov |
| 3/11/91 | 9:09 PM | 3.3 | 39.5 km | 10,000 m | Denmark | usgs.gov |
Nibe
Nibe is a town with a population of 5,093 (1 January 2014), located in Region Nordjylland on the Jutland Peninsula in northern Denmark. The town is located in a geographic region known as Himmerland. Nibe was the site of the municipal council of Nibe..
Nibe Wikipedia Page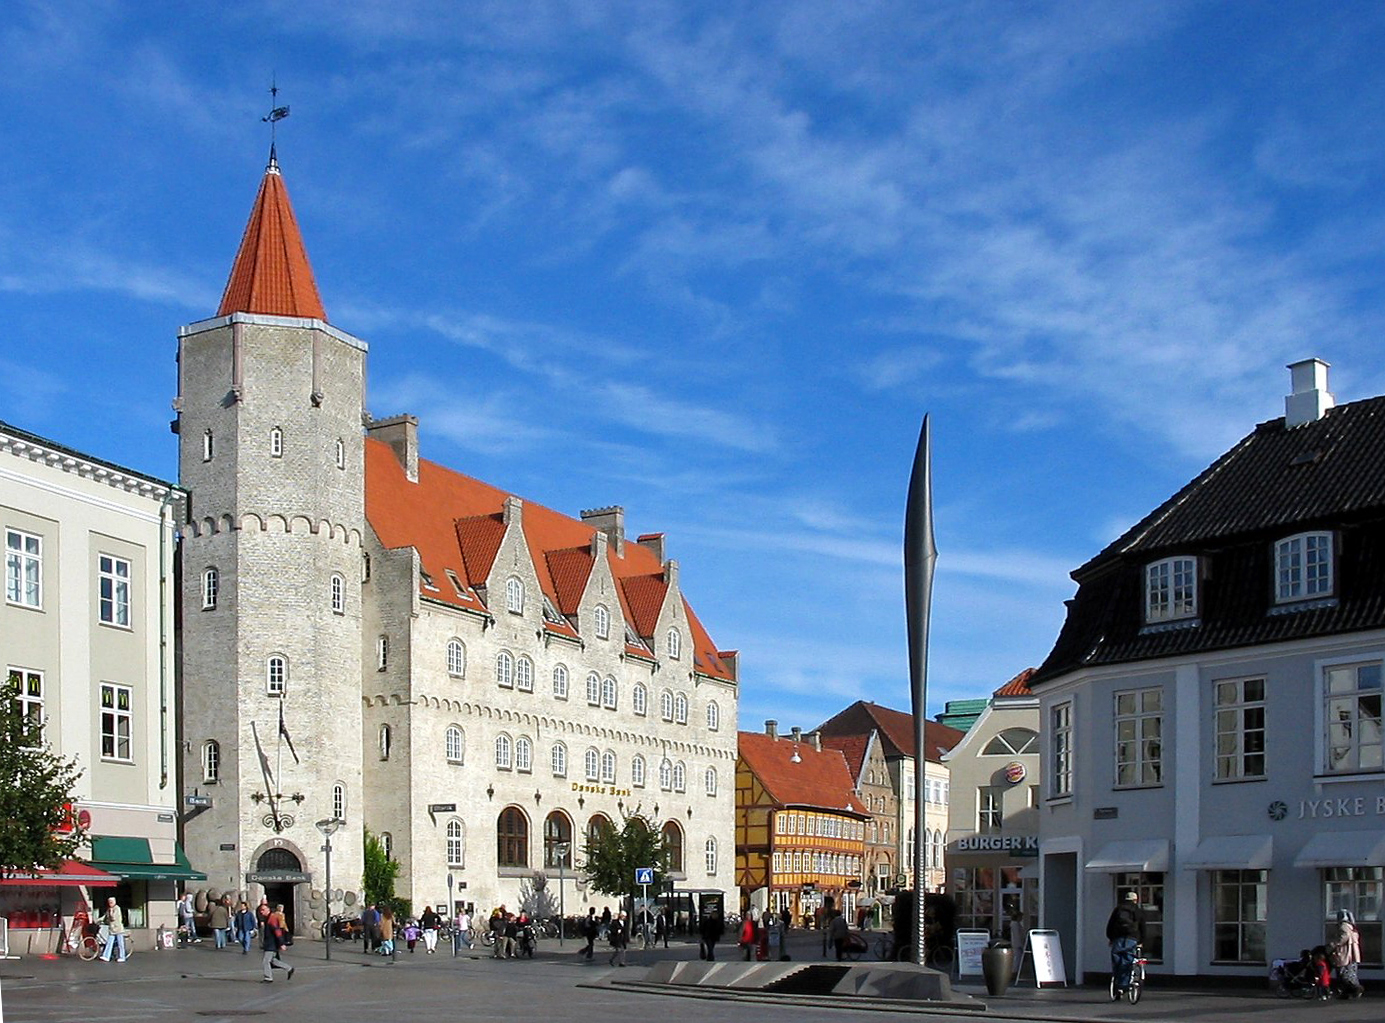


About Our Data
The data on this page is estimated using a number of publicly available tools and resources. It is provided without warranty, and could contain inaccuracies. Use at your own risk.