Industries
Business Distribution by Industry in Sejerø
| Industry Description | Number of Establishments |
|---|---|
| Construction of buildings | 12 |
| Other accommodation | 8 |
| Restaurants | 8 |
| Shopping other | 6 |
| Cafes | 5 |
| Other membership organizations | 5 |
Sejerø Facts
| Area | 0.2 km² |
| Population | 25 |
| Male Population | 12 (50.0%) |
| Female Population | 13 (50.0%) |
| Population change (1975 to 2020) | -78.6% |
| Population change (2000 to 2020) | -43.2% |
| Median Age | 60.5 years (Male: 60.6, Female: 60.3) |
| Local Time | |
| Timezone | Central European Summer Time |
| Lat & Lng | 55.88371, 11.14323 |
| Postal Codes | 4592 |
Map of Sejerø
Interactive Map
Sejerø Population
Years 1975 to 2020
| Data | 1975 | 1990 | 2000 | 2015 | 2020 |
|---|---|---|---|---|---|
| Population | 117 | 76 | 44 | 25 | 25 |
| Population Density | 624 / km² | 405.3 / km² | 234.7 / km² | 133.3 / km² | 133.3 / km² |
Sejerø Population change from 2000 to 2015
Decrease of 43.2% from year 2000 to 2015
| Location | Change since 1975 | Change since 1990 | Change since 2000 |
|---|---|---|---|
| Sejerø | -78.6% | -67.1% | -43.2% |
| Region Zealand | +2.2% | +1.7% | +0.6% |
| Denmark | +12.1% | +10.4% | +6.3% |
Sejerø Median Age
Median Age: 60.5 years
| Location | Median Age | Median Age (Female) | Median Age (Male) |
|---|---|---|---|
| Sejerø | 60.5 yrs | 60.3 yrs | 60.6 yrs |
| Region Zealand | 42.9 yrs | 43.7 yrs | 42.2 yrs |
| Denmark | 40.5 yrs | 41.3 yrs | 39.6 yrs |
Sejerø Population Density
Population Density: 133 / km²
| Location | Population | Area | Density |
|---|---|---|---|
| Sejerø | 25 | 0.188 km² | 133 / km² |
| Region Zealand | 802,458 | 7,343.5 km² | 109 / km² |
| Denmark | 5.5 million | 43,072 km² | 129 / km² |
Sejerø Historical and Projected Population
Estimated Population from 1975 to 2100
- JRC (European Commission's Joint Research Centre) work on the GHS built-up grid
- CIESIN (Center for International Earth Science Information Network)
- [Link] Klein Goldewijk, K., Beusen, A., Doelman, J., and Stehfest, E.: Anthropogenic land use estimates for the Holocene – HYDE 3.2, Earth Syst. Sci. Data, 9, 927–953, https://doi.org/10.5194/essd-9-927-2017, 2017.
Price Distribution
Business distribution by price for Sejerø
Human Development Index (HDI)
Statistic composite index of life expectancy, education, and per capita income.
Region Zealand CO2 Emissions
Carbon Dioxide (CO2) Emissions Per Capita in Tonnes Per Year
| Location | CO2 Emissions | CO2 Emissions Per Capita | CO2 Emissions Intensity |
|---|---|---|---|
| Region Zealand | 8,459,301 tn | 10.54 tn | 1,151.9 tons/km² |
| Denmark | 59,647,725 tn | 10.75 tn | 1,384.8 tons/km² |
| 2013 CO2 emissions (tonnes/year) | 8,459,301 tn |
| 2013 CO2 emissions (tonnes/year) per capita | 10.54 tn |
| 2013 CO2 emissions intensity (tonnes/km²/year) | 1,151.9 tons/km² |
Recent Nearby Earthquakes
Magnitude 3.0 and greater
| Date▼ | Time↕ | Magnitude↕ | Distance↕ | Depth↕ | Location↕ | Link |
|---|---|---|---|---|---|---|
| 8/6/12 | 2:57 AM | 4.2 | 98.3 km | 9,800 m | Sweden | usgs.gov |
| 2/3/05 | 5:49 PM | 3 | 37 km | 0 m | Denmark | usgs.gov |
| 2/3/05 | 3:49 PM | 3 | 29 km | 100 m | Denmark | usgs.gov |
| 5/30/95 | 4:00 AM | 3.2 | 65.2 km | 10,000 m | Denmark | usgs.gov |
| 4/1/86 | 9:56 AM | 4.2 | 84.4 km | 33,000 m | Sweden | usgs.gov |
| 6/15/85 | 12:40 AM | 4.4 | 83.9 km | 33,000 m | Sweden | usgs.gov |
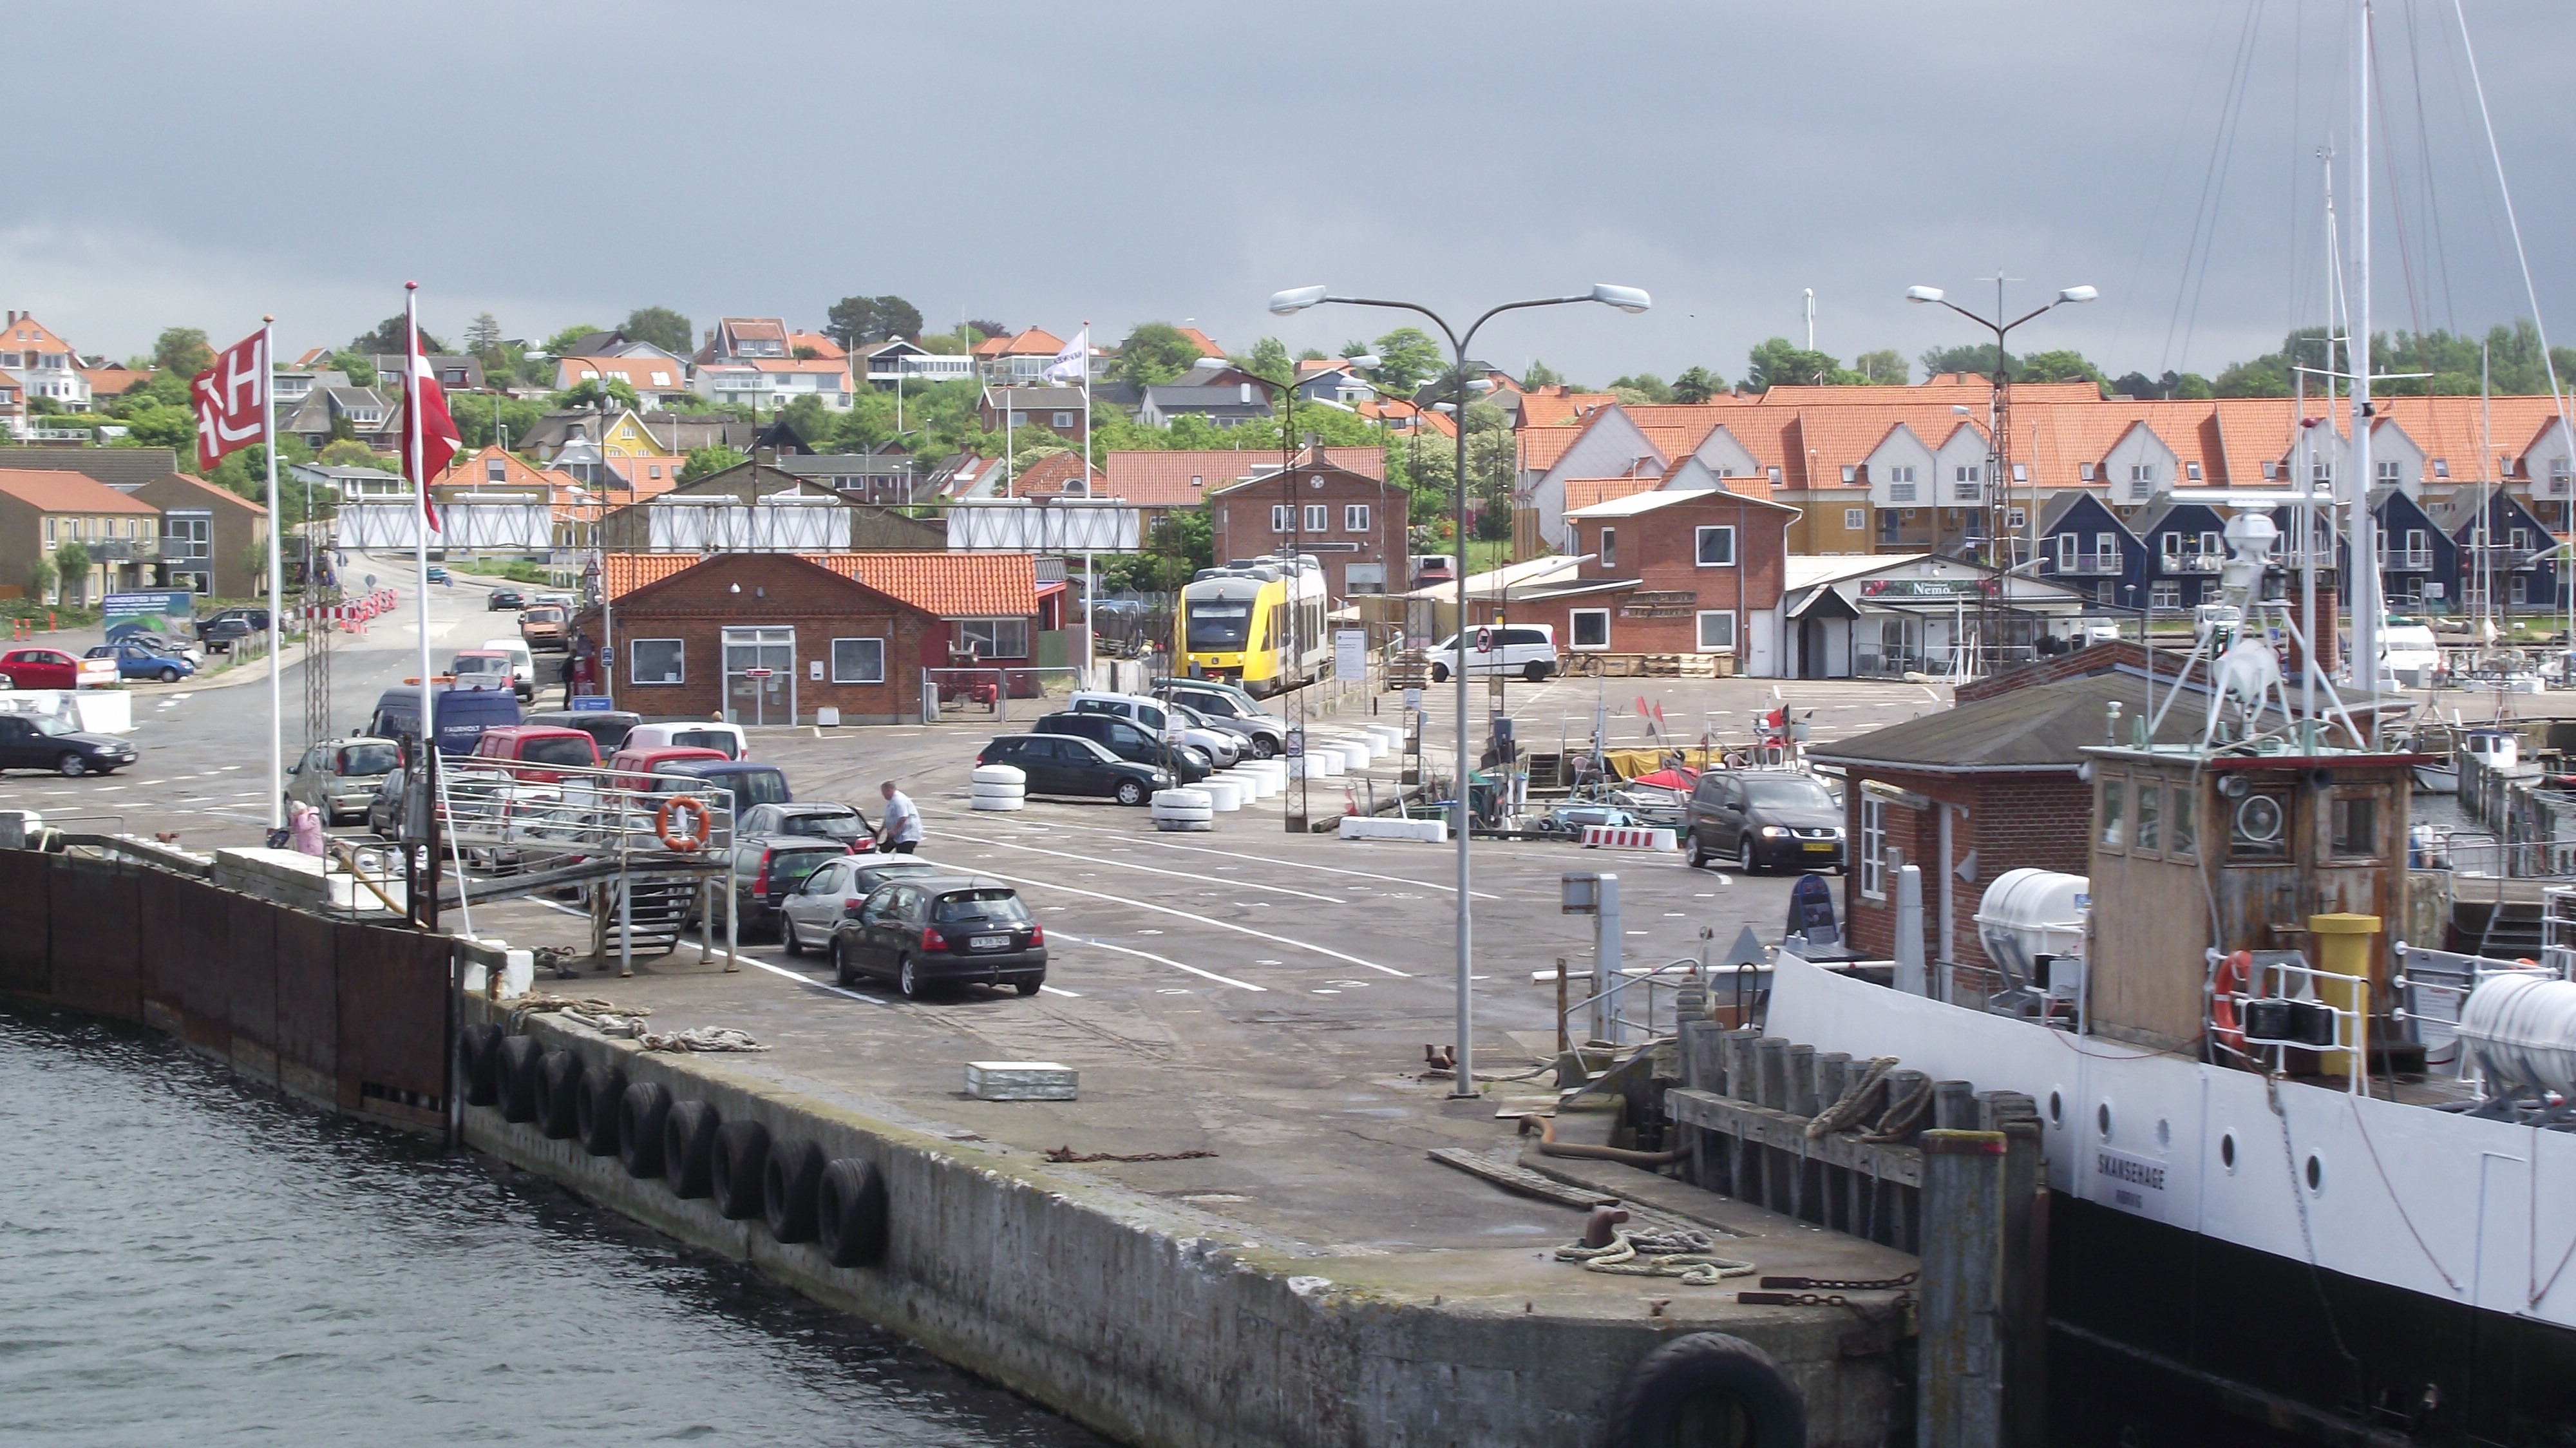
Sejerø
Sejerø is a Danish island in the Kattegat sea, north-west of Zealand. Sejerø with its 400 inhabitants is part of Kalundborg Municipality and covers an area of 12.36 km². The largest village on Sejerø is Sejerby, housing half of the island's populatio..
Sejerø Wikipedia Page


About Our Data
The data on this page is estimated using a number of publicly available tools and resources. It is provided without warranty, and could contain inaccuracies. Use at your own risk.