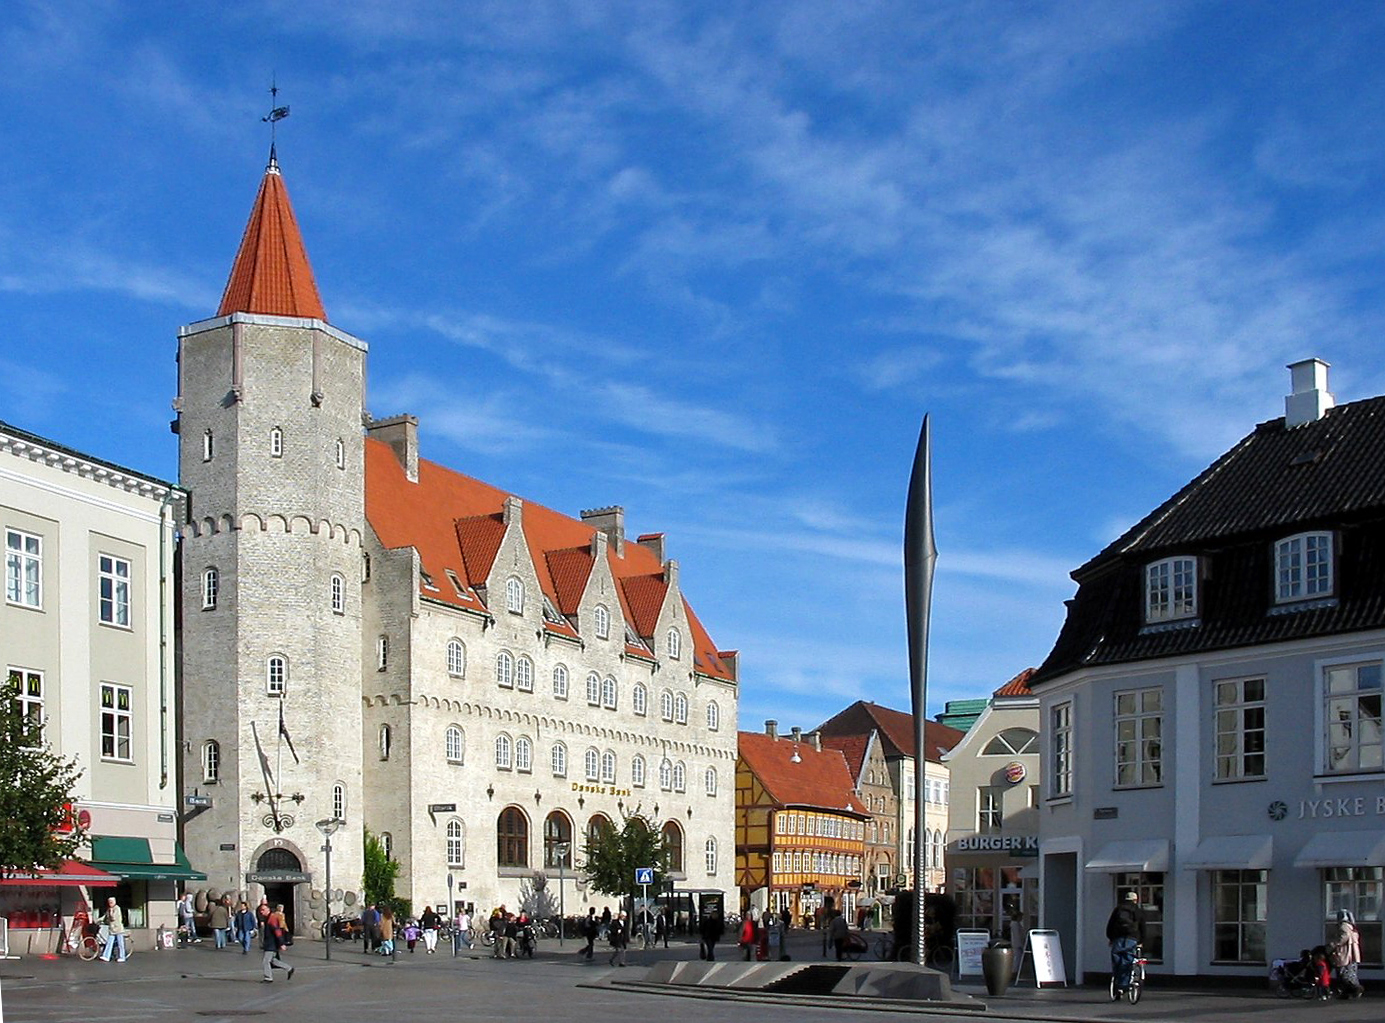
Categories in Strandby
Gas stationWholesale of construction suppliesWholesale of food, beverages and tobaccoWholesale of machineryAll membership organizationsChurchesOther membership organizationsPost officeElectronics storesConstruction of buildingsElectrical installationGeneral contractorsKitchen and bath cabinets and remodelOther constructionTechnical construction servicesEducationArt galleriesRestaurantsSeafood storesAccountantsBanksFinance otherLoan companiesHealth and medicalBeauty salonsGeneral cleaning servicesMail order and web storesRetail not in storesShoppingShopping otherBoatsFishing and tackle shopsBuses and trainsFreight/commercial transportOther transport activitiesUnreachable
Industries
Business Distribution by Industry in Strandby
| Industry Description | Number of Establishments | Average Google Rating |
|---|---|---|
| Unreachable | 16 | 4.5 |
| Shopping | 14 | 3.9 |
Strandby Facts
| Area | 3.4 km² |
| Population | 2,056 |
| Male Population | 1,041 (50.6%) |
| Female Population | 1,015 (49.4%) |
| Population change (1975 to 2020) | -35.5% |
| Population change (2000 to 2020) | -18.5% |
| Median Age | 45.6 years (Male: 45.4, Female: 45.8) |
| Local Time | |
| Timezone | Central European Summer Time |
| Lat & Lng | 57.49150, 10.49609 |
| Postal Codes | 9970 |
Map of Strandby
Interactive Map
Strandby Population
Years 1975 to 2020
| Data | 1975 | 1990 | 2000 | 2015 | 2020 |
|---|---|---|---|---|---|
| Population | 3,188 | 2,916 | 2,524 | 2,037 | 2,056 |
| Population Density | 944.6 / km² | 864 / km² | 747.9 / km² | 603.6 / km² | 609.2 / km² |
Sources: JRC (European Commission's Joint Research Centre) work on the GHS built-up grid
Strandby Population change from 2000 to 2015
Decrease of 19.3% from year 2000 to 2015
| Location | Change since 1975 | Change since 1990 | Change since 2000 |
|---|---|---|---|
| Strandby | -36.1% | -30.1% | -19.3% |
| North Denmark Region | +2.1% | +1.3% | +0.3% |
| Denmark | +12.1% | +10.4% | +6.3% |
Sources: JRC (European Commission's Joint Research Centre) work on the GHS built-up grid
Strandby Median Age
Median Age: 45.6 years
| Location | Median Age | Median Age (Female) | Median Age (Male) |
|---|---|---|---|
| Strandby | 45.6 yrs | 45.8 yrs | 45.4 yrs |
| North Denmark Region | 42 yrs | 43 yrs | 41 yrs |
| Denmark | 40.5 yrs | 41.3 yrs | 39.6 yrs |
Sources: CIESIN (Center for International Earth Science Information Network)
Strandby Population Density
Population Density: 609 / km²
| Location | Population | Area | Density |
|---|---|---|---|
| Strandby | 2,056 | 3.375 km² | 609 / km² |
| North Denmark Region | 566,100 | 7,966.1 km² | 71.1 / km² |
| Denmark | 5.5 million | 43,072 km² | 129 / km² |
Sources: JRC (European Commission's Joint Research Centre) work on the GHS built-up grid
Strandby Historical and Projected Population
Estimated Population from 0 to 2100
Sources:
- JRC (European Commission's Joint Research Centre) work on the GHS built-up grid
- CIESIN (Center for International Earth Science Information Network)
- [Link] Klein Goldewijk, K., Beusen, A., Doelman, J., and Stehfest, E.: Anthropogenic land use estimates for the Holocene – HYDE 3.2, Earth Syst. Sci. Data, 9, 927–953, https://doi.org/10.5194/essd-9-927-2017, 2017.
Price Distribution
Business distribution by price for Strandby
Human Development Index (HDI)
Statistic composite index of life expectancy, education, and per capita income.
Source: [Link] Kummu, M., Taka, M. &Guillaume, J. Gridded global datasets for Gross Domestic Product and Human Development Index over 1990–2015. Sci Data 5, 180004 (2018) doi:10.1038/sdata.2018.4
Strandby CO2 Emissions
Carbon Dioxide (CO2) Emissions Per Capita in Tonnes Per Year
| Location | CO2 Emissions | CO2 Emissions Per Capita | CO2 Emissions Intensity |
|---|---|---|---|
| Strandby | 9,452 tn | 4.6 tn | 2,800.7 tons/km² |
| North Denmark Region | 6,400,458 tn | 11.31 tn | 803.5 tons/km² |
| Denmark | 59,647,725 tn | 10.75 tn | 1,384.8 tons/km² |
Sources: [Link] Moran, D., Kanemoto K; Jiborn, M., Wood, R., Többen, J., and Seto, K.C. (2018) Carbon footprints of 13,000 cities. Environmental Research Letters DOI: 10.1088/1748-9326/aac72a
Strandby CO2 Emissions
| 2013 CO2 emissions (tonnes/year) | 9,452 tn |
| 2013 CO2 emissions (tonnes/year) per capita | 4.6 tn |
| 2013 CO2 emissions intensity (tonnes/km²/year) | 2,800.7 tons/km² |
Recent Nearby Earthquakes
Magnitude 3.0 and greater
| Date▼ | Time↕ | Magnitude↕ | Distance↕ | Depth↕ | Location↕ | Link |
|---|---|---|---|---|---|---|
| 7/29/15 | 7:46 PM | 3.4 | 90.7 km | 13,380 m | 7km WSW of Surte, Sweden | usgs.gov |
| 11/24/04 | 12:19 PM | 3 | 99.7 km | 10,200 m | Denmark | usgs.gov |
| 11/24/04 | 11:25 AM | 3.1 | 76 km | 15,000 m | Denmark | usgs.gov |
| 5/10/94 | 7:08 PM | 3.2 | 73.1 km | 35,000 m | Sweden | usgs.gov |
| 3/11/91 | 9:09 PM | 3.3 | 61.9 km | 10,000 m | Denmark | usgs.gov |
| 5/24/90 | 9:52 AM | 3.6 | 76.5 km | 5,000 m | Sweden | usgs.gov |
Source: U.S. Geological Survey (USGS)


About Our Data
The data on this page is estimated using a number of publicly available tools and resources. It is provided without warranty, and could contain inaccuracies. Use at your own risk.