Strib Facts
| Area | 2.8 km² |
| Population | 3,939 |
| Male Population | 1,957 (49.7%) |
| Female Population | 1,982 (50.3%) |
| Population change (1975 to 2020) | -13.4% |
| Population change (2000 to 2020) | -6.5% |
| Median Age | 45.3 years (Male: 44.9, Female: 45.8) |
| Local Time | |
| Timezone | Central European Summer Time |
| Lat & Lng | 55.54021, 9.76748 |
Map of Strib
Interactive Map
Strib Population
Years 1975 to 2020
| Data | 1975 | 1990 | 2000 | 2015 | 2020 |
|---|---|---|---|---|---|
| Population | 4,551 | 4,385 | 4,211 | 3,846 | 3,939 |
| Population Density | 1,654.9 / km² | 1,594.5 / km² | 1,531.3 / km² | 1,398.5 / km² | 1,432.4 / km² |
Strib Population change from 2000 to 2015
Decrease of 8.7% from year 2000 to 2015
| Location | Change since 1975 | Change since 1990 | Change since 2000 |
|---|---|---|---|
| Strib | -15.5% | -12.3% | -8.7% |
| Region of Southern Denmark | +4.3% | +4.1% | +2.2% |
| Denmark | +12.1% | +10.4% | +6.3% |
Strib Median Age
Median Age: 45.3 years
| Location | Median Age | Median Age (Female) | Median Age (Male) |
|---|---|---|---|
| Strib | 45.3 yrs | 45.8 yrs | 44.9 yrs |
| Region of Southern Denmark | 41.6 yrs | 42.4 yrs | 40.8 yrs |
| Denmark | 40.5 yrs | 41.3 yrs | 39.6 yrs |
Strib Population Density
Population Density: 1,432 / km²
| Location | Population | Area | Density |
|---|---|---|---|
| Strib | 3,939 | 2.75 km² | 1,432 / km² |
| Region of Southern Denmark | 1.2 million | 12,185.6 km² | 97.6 / km² |
| Denmark | 5.5 million | 43,072 km² | 129 / km² |
Strib Historical and Projected Population
Estimated Population from 100 to 2100
- JRC (European Commission's Joint Research Centre) work on the GHS built-up grid
- CIESIN (Center for International Earth Science Information Network)
- [Link] Klein Goldewijk, K., Beusen, A., Doelman, J., and Stehfest, E.: Anthropogenic land use estimates for the Holocene – HYDE 3.2, Earth Syst. Sci. Data, 9, 927–953, https://doi.org/10.5194/essd-9-927-2017, 2017.
Human Development Index (HDI)
Statistic composite index of life expectancy, education, and per capita income.
Strib CO2 Emissions
Carbon Dioxide (CO2) Emissions Per Capita in Tonnes Per Year
| Location | CO2 Emissions | CO2 Emissions Per Capita | CO2 Emissions Intensity |
|---|---|---|---|
| Strib | 43,340 tn | 11 tn | 15,760 tons/km² |
| Region of Southern Denmark | 13,078,559 tn | 11 tn | 1,073.3 tons/km² |
| Denmark | 59,647,725 tn | 10.75 tn | 1,384.8 tons/km² |
| 2013 CO2 emissions (tonnes/year) | 43,340 tn |
| 2013 CO2 emissions (tonnes/year) per capita | 11 tn |
| 2013 CO2 emissions intensity (tonnes/km²/year) | 15,760 tons/km² |
Natural Hazards Risk
Relative risk out of 10
| Hazard | Risk Level |
|---|---|
| Drought | Low (2) |
* Risk, particularly concerning flood or landslide, may not be for the entire area.
- Dilley, M., R.S. Chen, U. Deichmann, A.L. Lerner-Lam, M. Arnold, J. Agwe, P. Buys, O. Kjekstad, B. Lyon, and G. Yetman. 2005. Natural Disaster Hotspots: A Global Risk Analysis. Washington, D.C.: World Bank. https://doi.org/10.1596/0-8213-5930-4.
- Center for Hazards and Risk Research - CHRR - Columbia University, Center for International Earth Science Information Network - CIESIN - Columbia University, and International Research Institute for Climate and Society - IRI - Columbia University. 2005. Global Drought Hazard Frequency and Distribution. Palisades, NY: NASA Socioeconomic Data and Applications Center (SEDAC). https://doi.org/10.7927/H4VX0DFT.
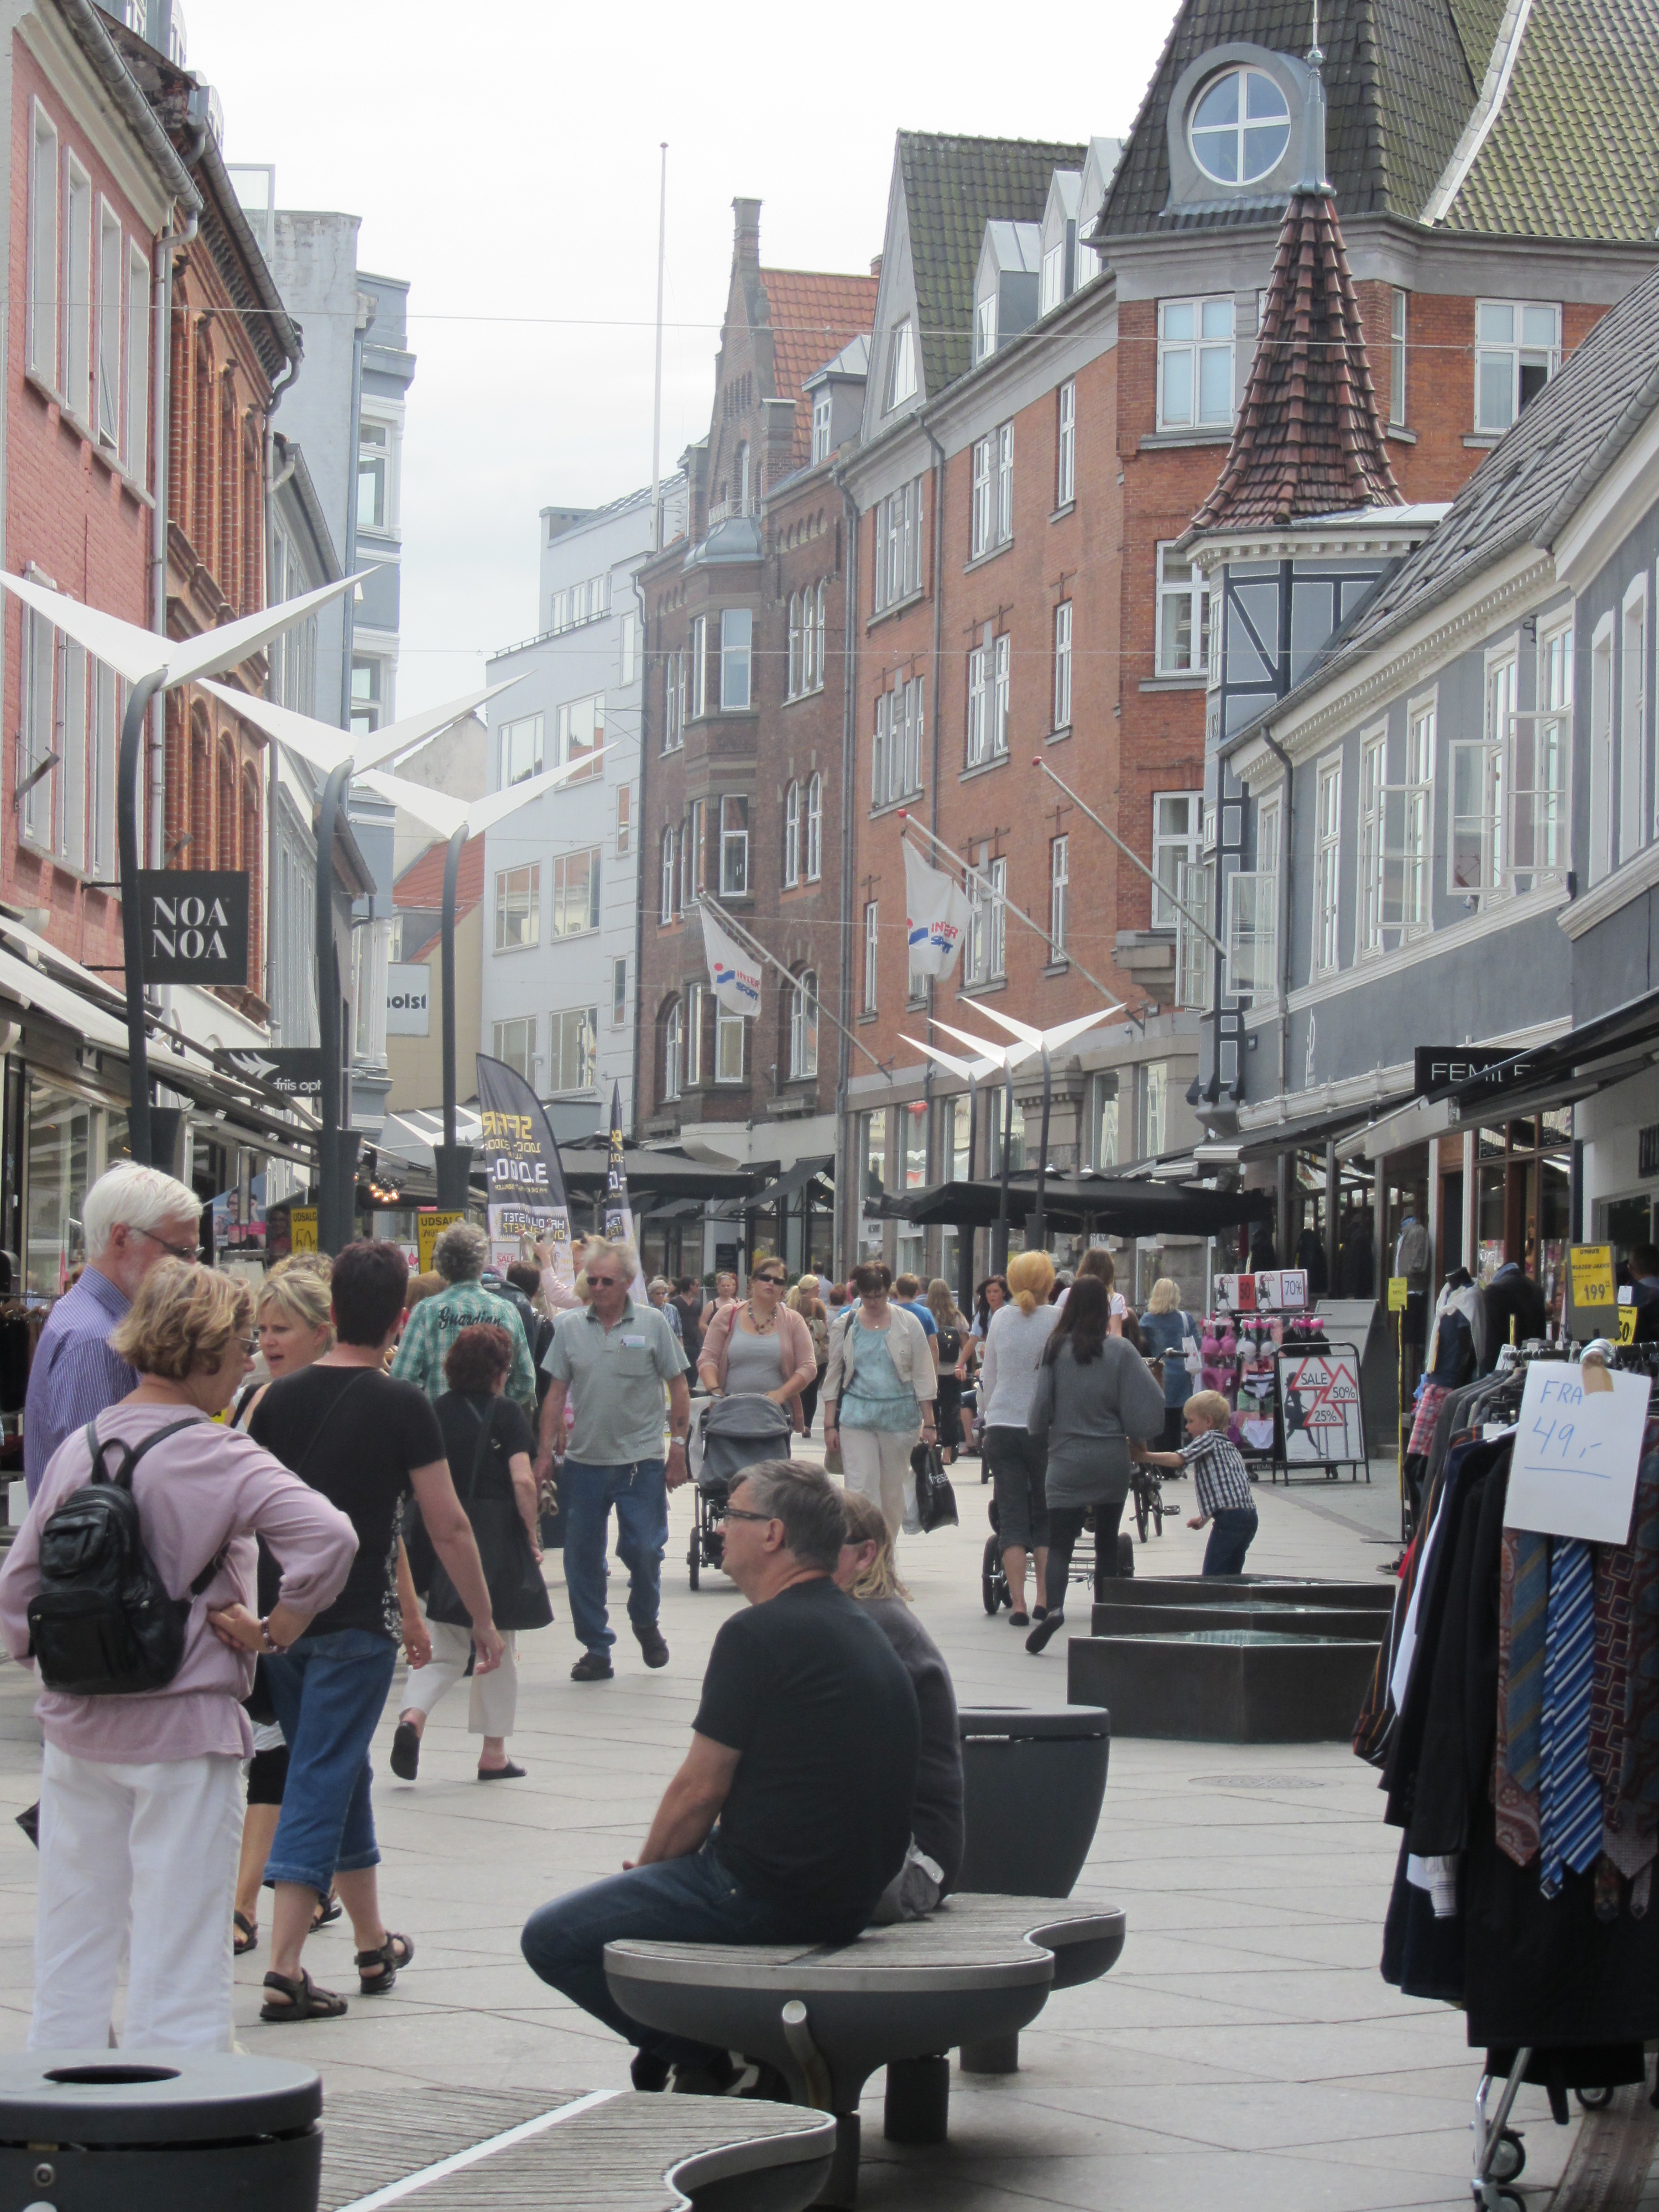
Strib
Strib is a town in Region of Southern Denmark, Denmark. It is located at 55° North, 9° East, and has a population of 4,449 (1 January 2014). The closest large towns are Middelfart and Fredericia. The town lies at an altitude just a few meters above s..
Strib Wikipedia Page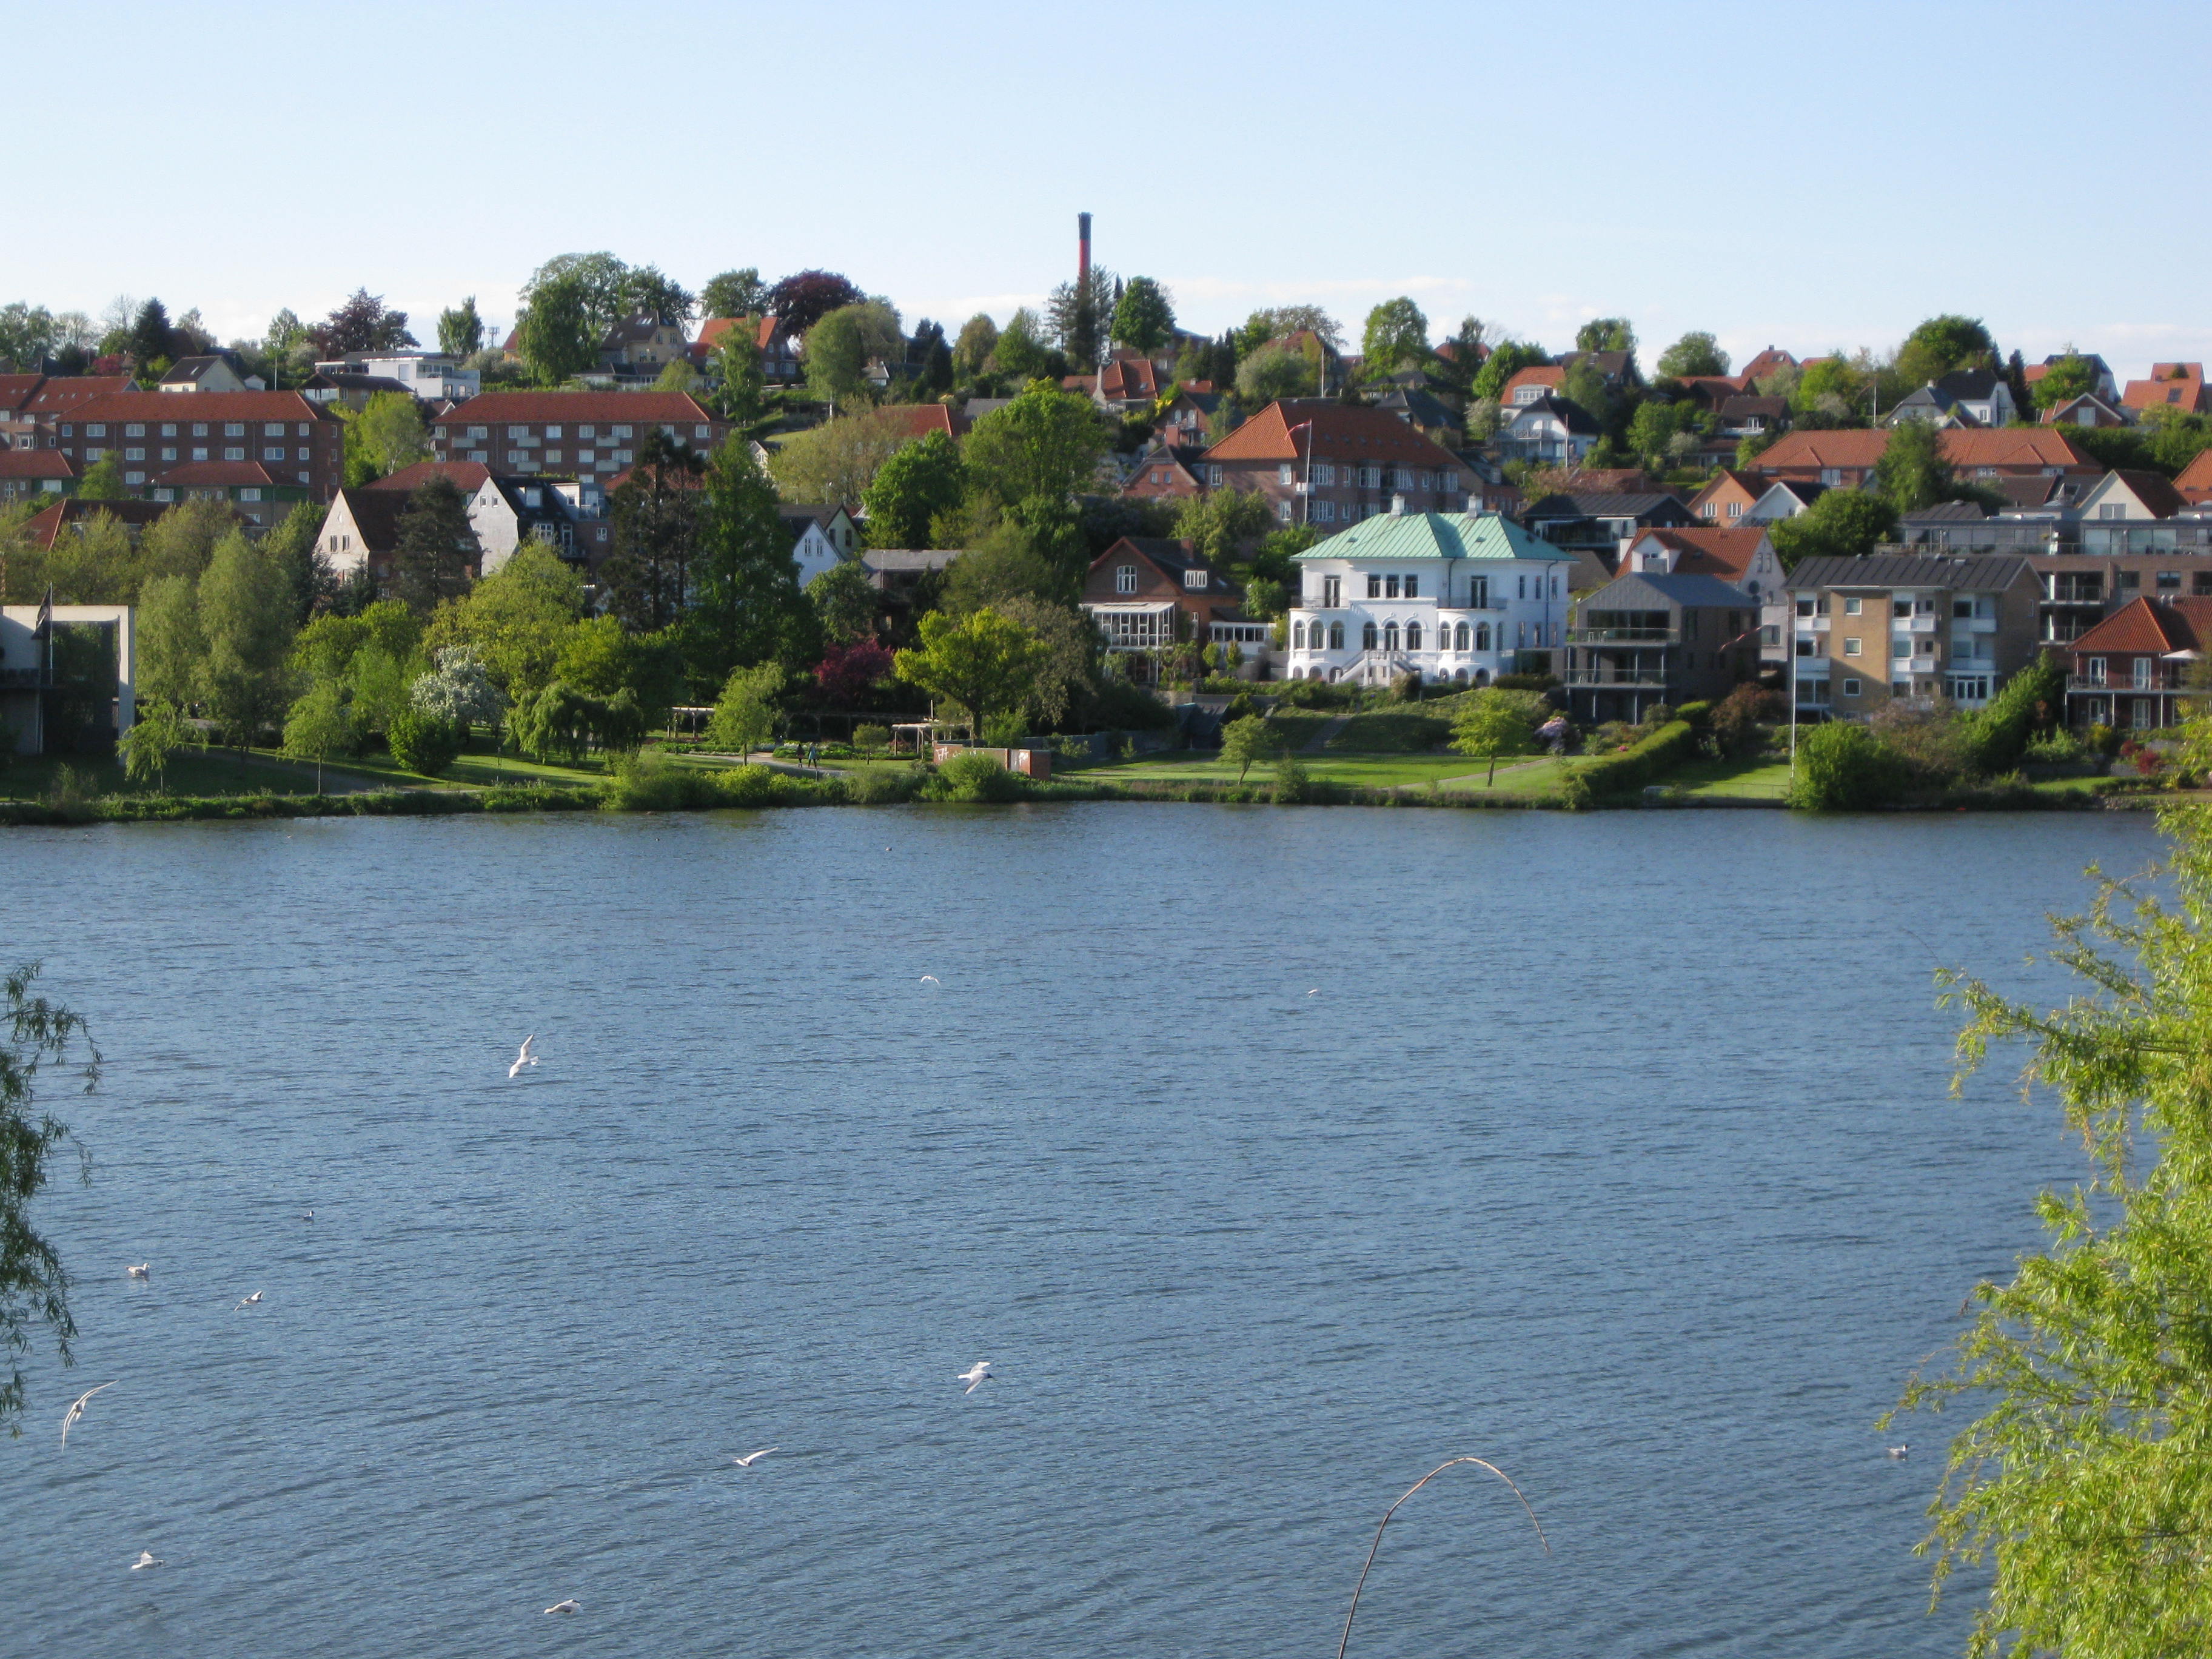

About Our Data
The data on this page is estimated using a number of publicly available tools and resources. It is provided without warranty, and could contain inaccuracies. Use at your own risk.