Categories in Vorbasse
Industries
Business Distribution by Industry in Vorbasse
| Industry Description | Number of Establishments | Average Google Rating |
|---|---|---|
| Shopping | 14 | 4.1 |
Vorbasse Facts
| Area | 1.1 km² |
| Population | 870 |
| Population change (1975 to 2020) | -25.4% |
| Population change (2000 to 2020) | -10.4% |
| Local Time | |
| Timezone | Central European Summer Time |
| Lat & Lng | 55.62992, 9.08239 |
| Postal Codes | 6623 |
Map of Vorbasse
Interactive Map
Vorbasse Population
Years 1975 to 2020
| Data | 1975 | 1990 | 2000 | 2015 | 2020 |
|---|---|---|---|---|---|
| Population | 1,167 | 1,094 | 971 | 859 | 870 |
| Population Density | 1,098.4 / km² | 1,029.6 / km² | 913.9 / km² | 808.5 / km² | 818.8 / km² |
Vorbasse Population change from 2000 to 2015
Decrease of 11.5% from year 2000 to 2015
| Location | Change since 1975 | Change since 1990 | Change since 2000 |
|---|---|---|---|
| Vorbasse | -26.4% | -21.5% | -11.5% |
| Region of Southern Denmark | +4.3% | +4.1% | +2.2% |
| Denmark | +12.1% | +10.4% | +6.3% |
Vorbasse Population Density
Population Density: 819 / km²
| Location | Population | Area | Density |
|---|---|---|---|
| Vorbasse | 870 | 1.063 km² | 819 / km² |
| Region of Southern Denmark | 1.2 million | 12,185.6 km² | 97.6 / km² |
| Denmark | 5.5 million | 43,072 km² | 129 / km² |
Vorbasse Historical and Projected Population
Estimated Population from 0 to 2100
- JRC (European Commission's Joint Research Centre) work on the GHS built-up grid
- CIESIN (Center for International Earth Science Information Network)
- [Link] Klein Goldewijk, K., Beusen, A., Doelman, J., and Stehfest, E.: Anthropogenic land use estimates for the Holocene – HYDE 3.2, Earth Syst. Sci. Data, 9, 927–953, https://doi.org/10.5194/essd-9-927-2017, 2017.
Price Distribution
Business distribution by price for Vorbasse
Human Development Index (HDI)
Statistic composite index of life expectancy, education, and per capita income.
Vorbasse CO2 Emissions
Carbon Dioxide (CO2) Emissions Per Capita in Tonnes Per Year
| Location | CO2 Emissions | CO2 Emissions Per Capita | CO2 Emissions Intensity |
|---|---|---|---|
| Vorbasse | 9,819 tn | 11.29 tn | 9,241.8 tons/km² |
| Region of Southern Denmark | 13,078,559 tn | 11 tn | 1,073.3 tons/km² |
| Denmark | 59,647,725 tn | 10.75 tn | 1,384.8 tons/km² |
| 2013 CO2 emissions (tonnes/year) | 9,819 tn |
| 2013 CO2 emissions (tonnes/year) per capita | 11.29 tn |
| 2013 CO2 emissions intensity (tonnes/km²/year) | 9,241.8 tons/km² |
Natural Hazards Risk
Relative risk out of 10
| Hazard | Risk Level |
|---|---|
| Drought | Low (2) |
* Risk, particularly concerning flood or landslide, may not be for the entire area.
- Dilley, M., R.S. Chen, U. Deichmann, A.L. Lerner-Lam, M. Arnold, J. Agwe, P. Buys, O. Kjekstad, B. Lyon, and G. Yetman. 2005. Natural Disaster Hotspots: A Global Risk Analysis. Washington, D.C.: World Bank. https://doi.org/10.1596/0-8213-5930-4.
- Center for Hazards and Risk Research - CHRR - Columbia University, Center for International Earth Science Information Network - CIESIN - Columbia University, and International Research Institute for Climate and Society - IRI - Columbia University. 2005. Global Drought Hazard Frequency and Distribution. Palisades, NY: NASA Socioeconomic Data and Applications Center (SEDAC). https://doi.org/10.7927/H4VX0DFT.
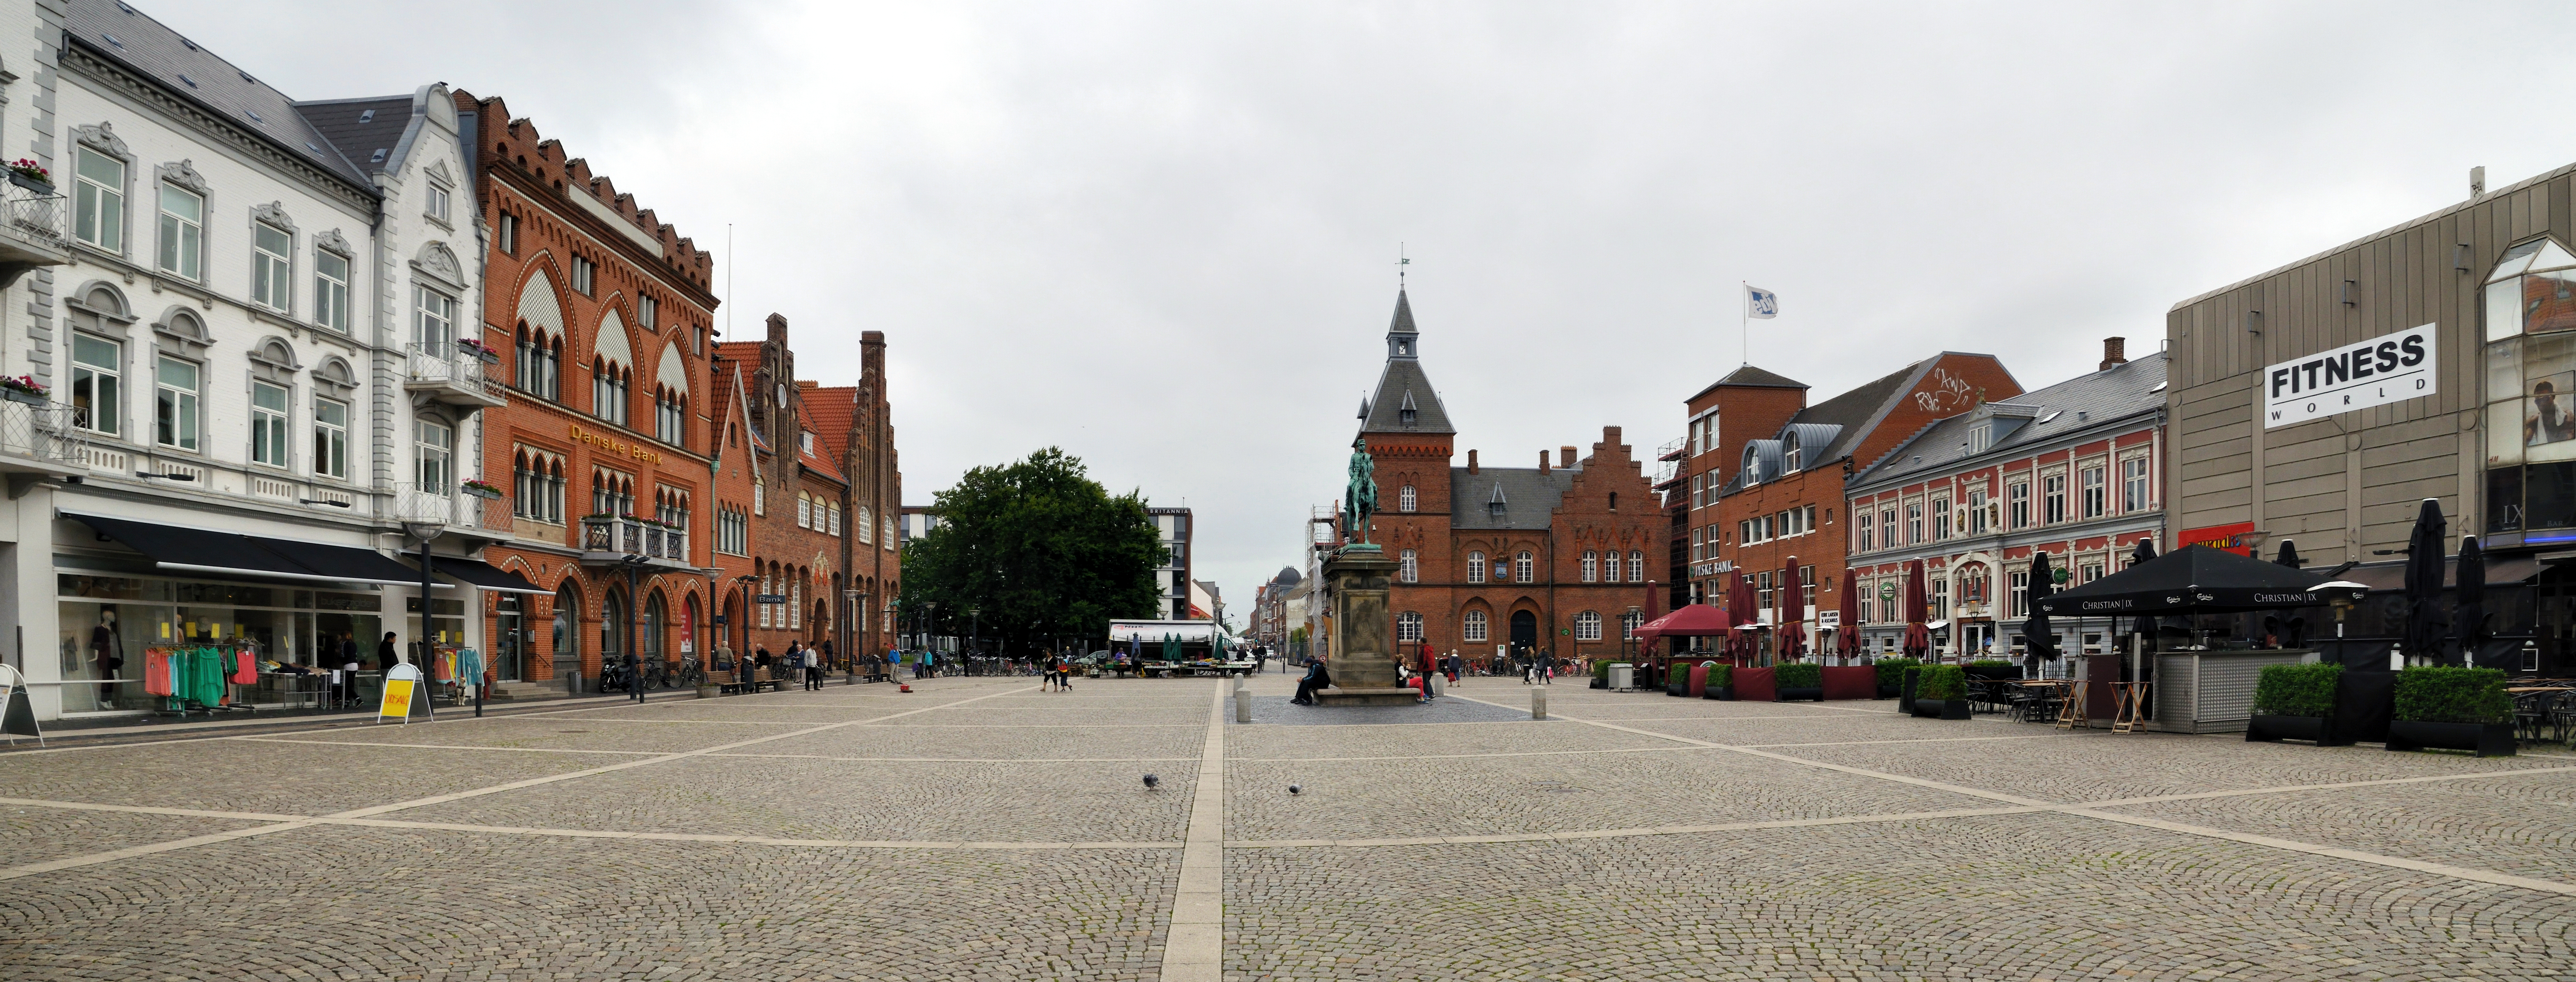
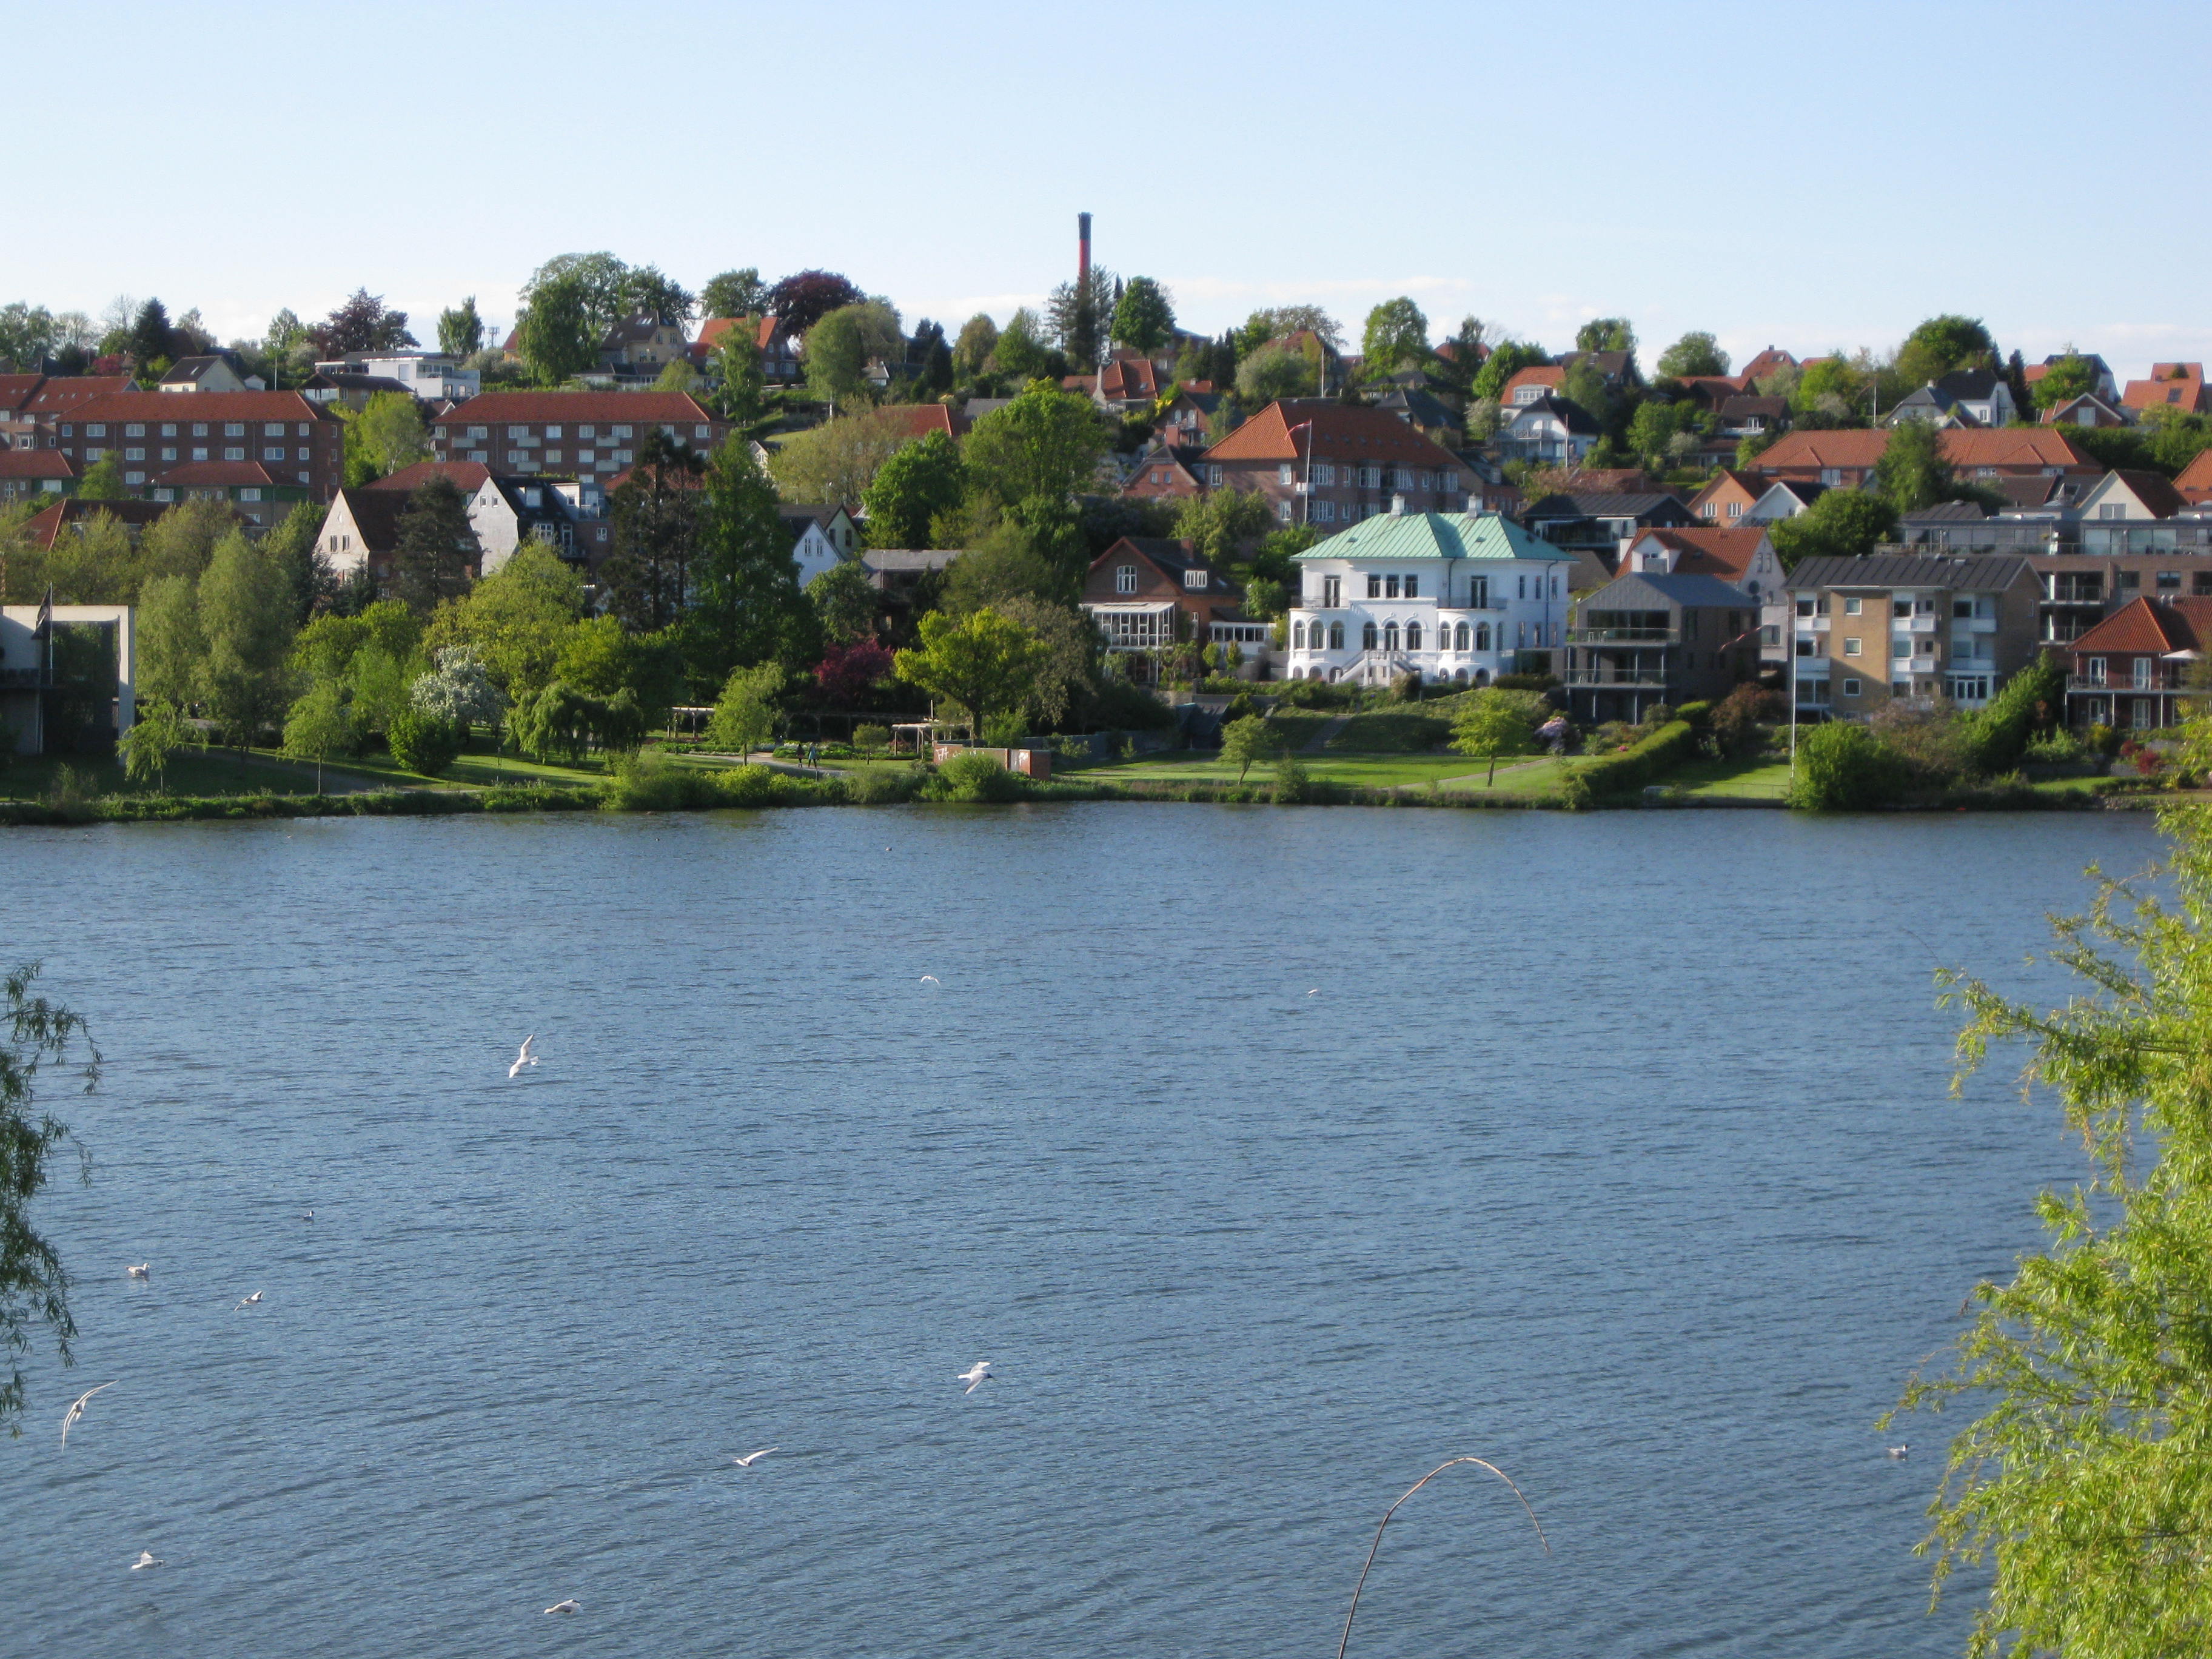
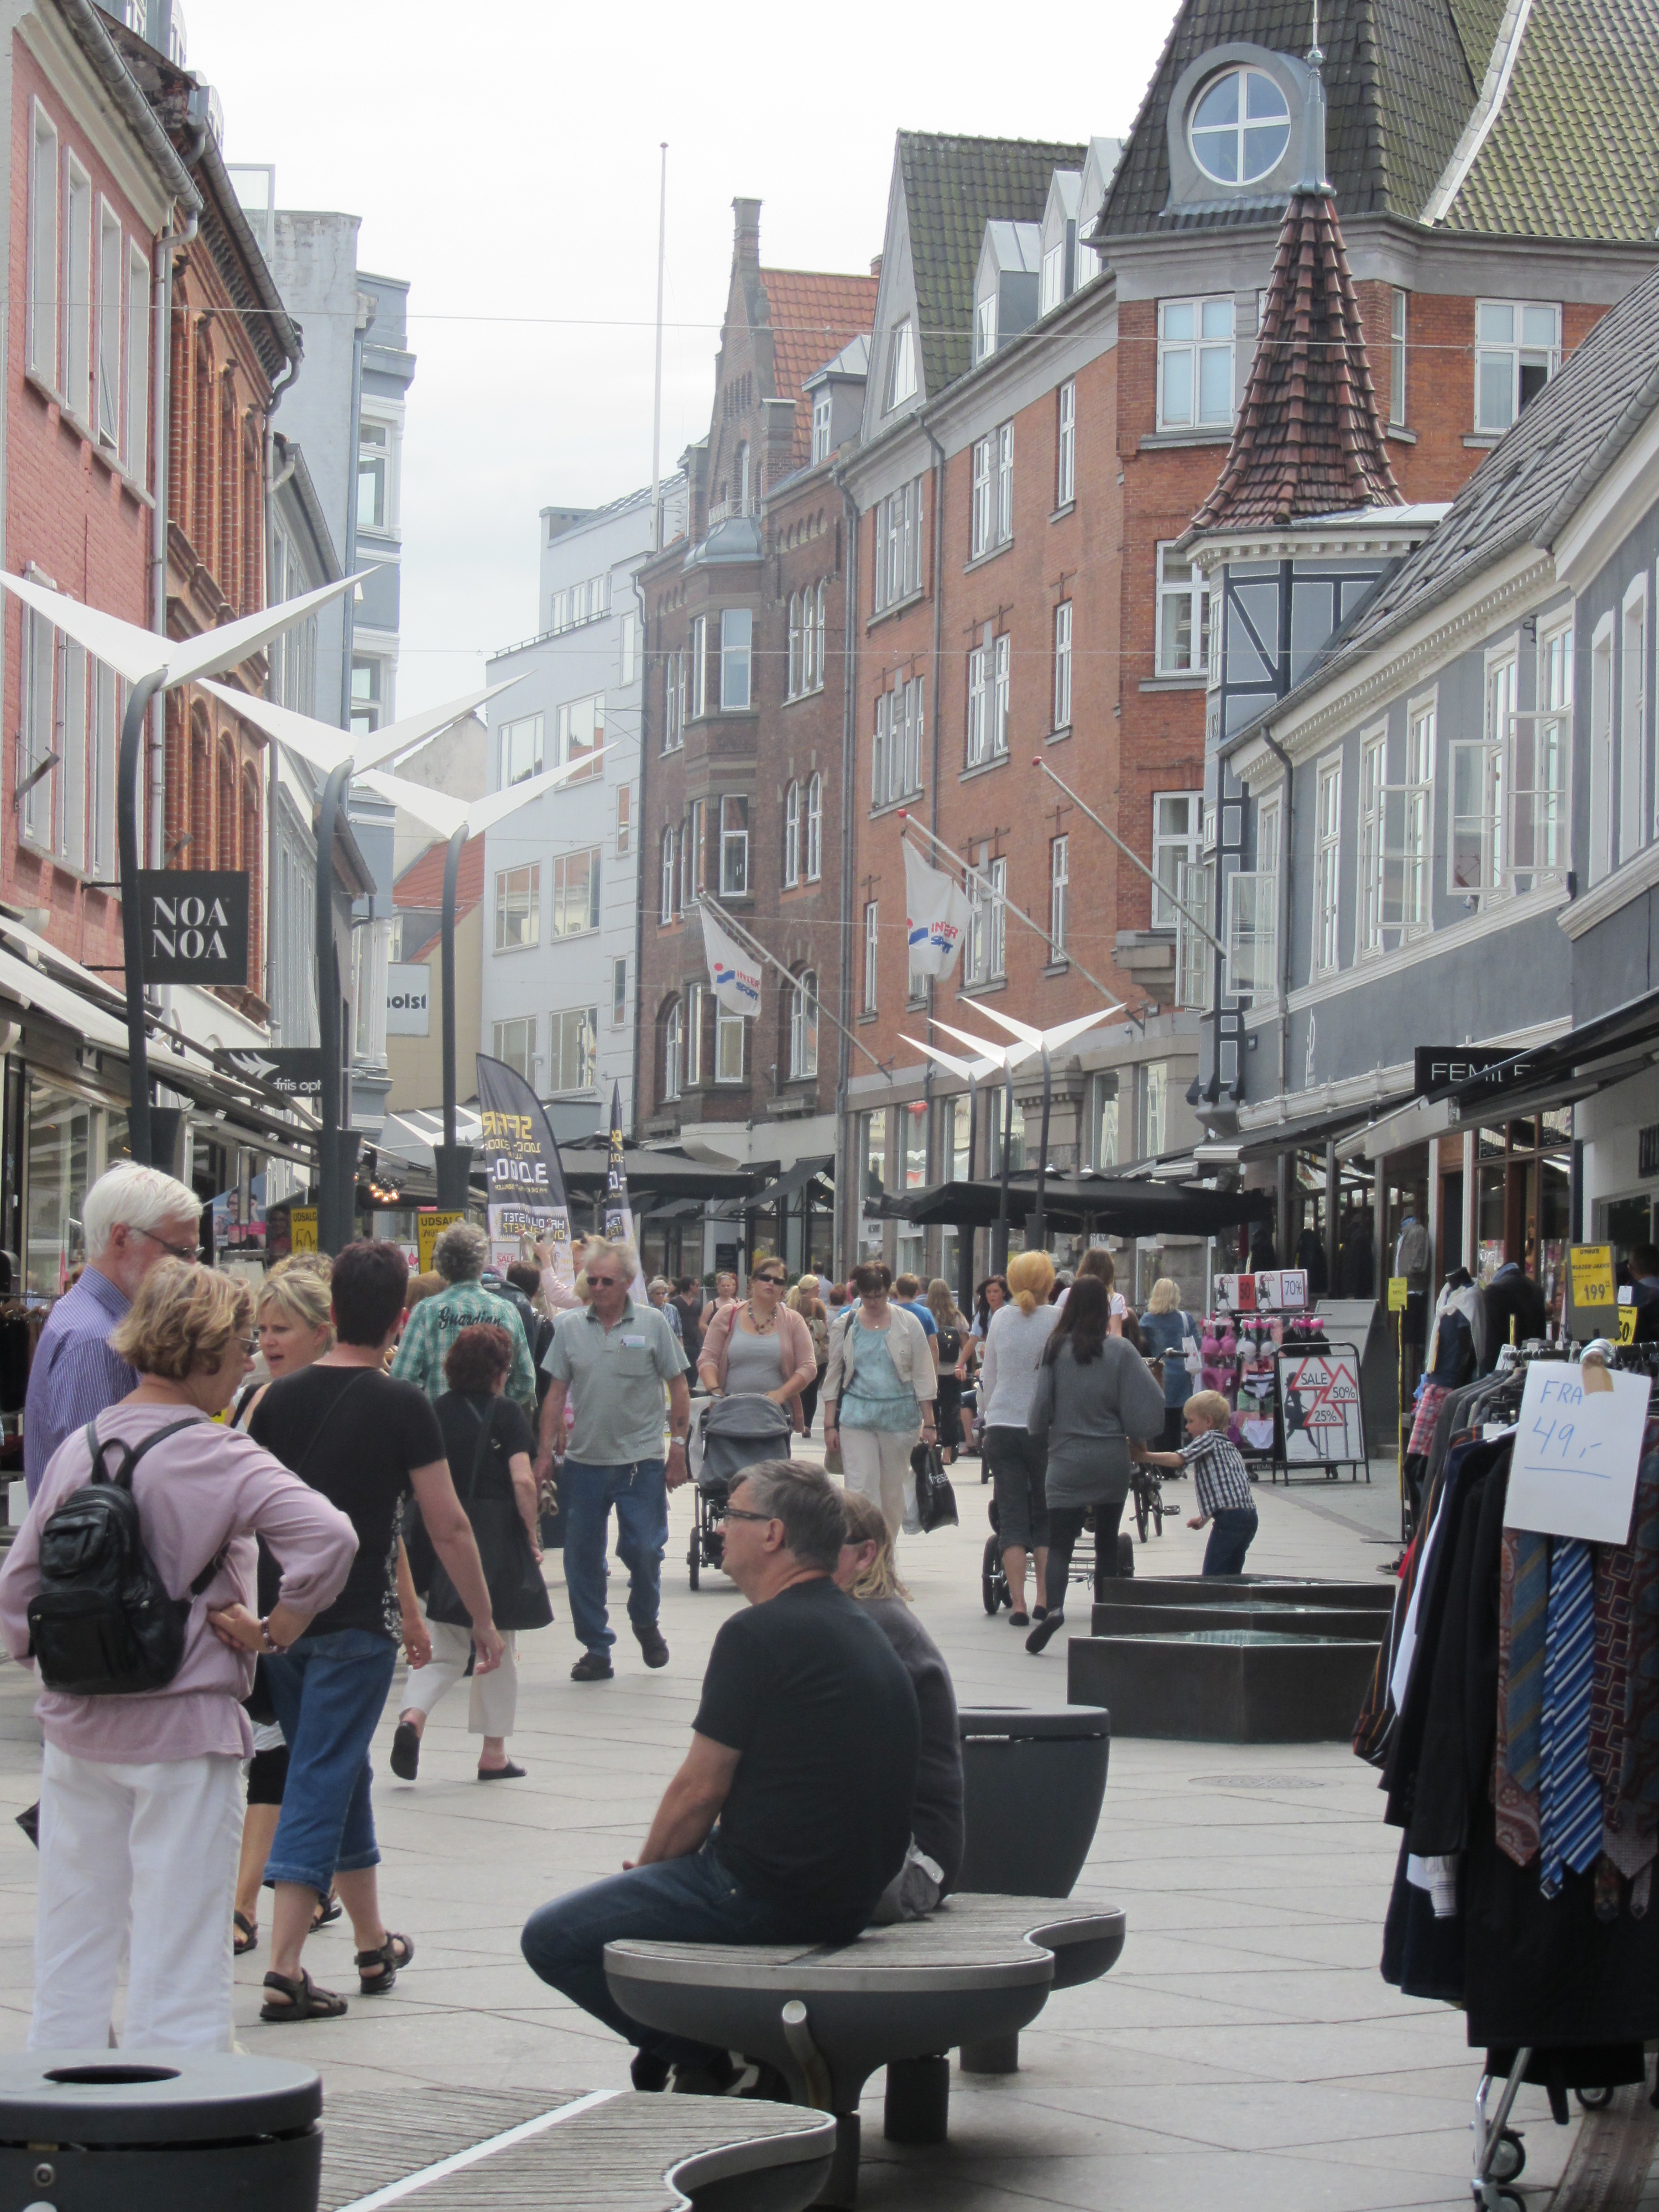
Vorbasse
Vorbasse with a population of 1,269 (1 January 2014) is the 4th largest town in Billund Municipality, Region of Southern Denmark, Denmark. , the biggest market in Denmark is arranged, Vorbasse Market (running for the 275th year, as of 2005), with app..
Vorbasse Wikipedia Page
About Our Data
The data on this page is estimated using a number of publicly available tools and resources. It is provided without warranty, and could contain inaccuracies. Use at your own risk.