Categories in Annaba
Industries
Business Distribution by Industry in Annaba
| Industry Description | Number of Establishments |
|---|---|
| Shopping | 297 |
| Restaurants | 282 |
| Education | 245 |
| Clothing stores | 193 |
| Apartments | 174 |
| Health and medical | 162 |
| Pharmacies and drug stores | 157 |
| Electronics stores | 156 |
| Public administration | 132 |
| Corporate management | 131 |
| Cafes | 123 |
Annaba Facts
| Area | 48.9 km² |
| Population | 277,244 |
| Male Population | 137,156 (49.5%) |
| Female Population | 140,088 (50.5%) |
| Population change (1975 to 2020) | +100.6% |
| Population change (2000 to 2020) | +9.0% |
| Median Age | 30.6 years (Male: 30, Female: 31.2) |
| Area Codes | 38 |
| Neighborhoods | Vieille Ville, Oued Kouba, Sidi Salem, Ben Amar, Cité des Orangers |
| Local Time | |
| Timezone | Central European Standard Time |
| Lat & Lng | 36.90000, 7.76667 |
| Postal Codes | 23000, 23001, 23002, 23003, 23007, More |
Map of Annaba
Interactive Map
Annaba Population
Years 1975 to 2020
| Data | 1975 | 1990 | 2000 | 2015 | 2020 |
|---|---|---|---|---|---|
| Population | 138,179 | 229,229 | 254,448 | 262,288 | 277,244 |
| Population Density | 2,827.2 / km² | 4,690.1 / km² | 5,206.1 / km² | 5,366.5 / km² | 5,672.5 / km² |
Annaba Population change from 2000 to 2015
Increase of 3.1% from year 2000 to 2015
| Location | Change since 1975 | Change since 1990 | Change since 2000 |
|---|---|---|---|
| Annaba | +89.8% | +14.4% | +3.1% |
| Annaba Province | +20.3% | +28.8% | +22.6% |
| Algeria | +137.8% | +53.3% | +27.3% |
Annaba Median Age
Median Age: 30.6 years
| Location | Median Age | Median Age (Female) | Median Age (Male) |
|---|---|---|---|
| Annaba | 30.6 yrs | 31.2 yrs | 30 yrs |
| Annaba Province | 28.7 yrs | 29.1 yrs | 28.4 yrs |
| Algeria | 25.1 yrs | 25.3 yrs | 24.9 yrs |
Annaba Population Density
Population Density: 5,673 / km²
| Location | Population | Area | Density |
|---|---|---|---|
| Annaba | 277,244 | 48.9 km² | 5,673 / km² |
| Annaba Province | 681,449 | 1,459.8 km² | 467 / km² |
| Algeria | 39.5 million | 2,312,254.9 km² | 17.1 / km² |
Annaba Historical and Projected Population
Estimated Population from 0 to 2100
- JRC (European Commission's Joint Research Centre) work on the GHS built-up grid
- CIESIN (Center for International Earth Science Information Network)
- [Link] Klein Goldewijk, K., Beusen, A., Doelman, J., and Stehfest, E.: Anthropogenic land use estimates for the Holocene – HYDE 3.2, Earth Syst. Sci. Data, 9, 927–953, https://doi.org/10.5194/essd-9-927-2017, 2017.
Neighborhoods in Annaba
Percentage of businesses by neighborhood in Annaba
Area Codes
Percentage Area Codes used by businesses in Annaba
Price Distribution
Business distribution by price for Annaba
Human Development Index (HDI)
Statistic composite index of life expectancy, education, and per capita income.
Annaba CO2 Emissions
Carbon Dioxide (CO2) Emissions Per Capita in Tonnes Per Year
| Location | CO2 Emissions | CO2 Emissions Per Capita | CO2 Emissions Intensity |
|---|---|---|---|
| Annaba | 533,558 tn | 1.92 tn | 10,916.8 tons/km² |
| Annaba Province | 1,453,928 tn | 2.13 tn | 996 tons/km² |
| Algeria | 69,721,458 tn | 1.77 tn | 30.2 tons/km² |
| 2013 CO2 emissions (tonnes/year) | 533,558 tn |
| 2013 CO2 emissions (tonnes/year) per capita | 1.92 tn |
| 2013 CO2 emissions intensity (tonnes/km²/year) | 10,916.8 tons/km² |
Natural Hazards Risk
Relative risk out of 10
| Hazard | Risk Level |
|---|---|
| Drought | Low (2) |
| Flood | High (8) |
| Earthquake | Medium (3.9) |
* Risk, particularly concerning flood or landslide, may not be for the entire area.
- Dilley, M., R.S. Chen, U. Deichmann, A.L. Lerner-Lam, M. Arnold, J. Agwe, P. Buys, O. Kjekstad, B. Lyon, and G. Yetman. 2005. Natural Disaster Hotspots: A Global Risk Analysis. Washington, D.C.: World Bank. https://doi.org/10.1596/0-8213-5930-4.
- Center for Hazards and Risk Research - CHRR - Columbia University, Center for International Earth Science Information Network - CIESIN - Columbia University, and International Research Institute for Climate and Society - IRI - Columbia University. 2005. Global Drought Hazard Frequency and Distribution. Palisades, NY: NASA Socioeconomic Data and Applications Center (SEDAC). https://doi.org/10.7927/H4VX0DFT.
- Center for Hazards and Risk Research - CHRR - Columbia University, Center for International Earth Science Information Network - CIESIN - Columbia University. 2005. Global Flood Hazard Frequency and Distribution. Palisades, NY: NASA Socioeconomic Data and Applications Center (SEDAC). https://doi.org/10.7927/H4668B3D.
- Center for Hazards and Risk Research - CHRR - Columbia University, Center for International Earth Science Information Network - CIESIN - Columbia University. 2005. Global Earthquake Hazard Distribution - Peak Ground Acceleration. Palisades, NY: NASA Socioeconomic Data and Applications Center (SEDAC). https://doi.org/10.7927/H4BZ63ZS.
Recent Nearby Earthquakes
Magnitude 3.0 and greater
| Date▼ | Time↕ | Magnitude↕ | Distance↕ | Depth↕ | Location↕ | Link |
|---|---|---|---|---|---|---|
| 3/5/17 | 1:46 AM | 4.7 | 99.8 km | 10,380 m | 13km NE of Didouche Mourad, Algeria | usgs.gov |
| 1/9/12 | 12:45 PM | 4.2 | 66.4 km | 8,500 m | Tunisia | usgs.gov |
| 6/2/08 | 8:02 PM | 3.9 | 76.8 km | 10,000 m | northern Algeria | usgs.gov |
| 5/17/08 | 5:15 PM | 4.3 | 67.1 km | 10,000 m | northern Algeria | usgs.gov |
| 4/15/08 | 4:05 AM | 4.2 | 81.5 km | 0 m | Tunisia | usgs.gov |
| 1/31/08 | 6:04 PM | 4.4 | 81.7 km | 0 m | northern Algeria | usgs.gov |
| 1/7/06 | 1:54 PM | 4 | 70.5 km | 0 m | northern Algeria | usgs.gov |
| 7/2/04 | 9:18 PM | 4.1 | 61.2 km | 10,000 m | Tunisia | usgs.gov |
| 1/22/04 | 5:30 AM | 4.3 | 49.4 km | 10,000 m | Tunisia | usgs.gov |
| 9/20/03 | 11:50 AM | 4.6 | 48.5 km | 10,000 m | northern Algeria | usgs.gov |
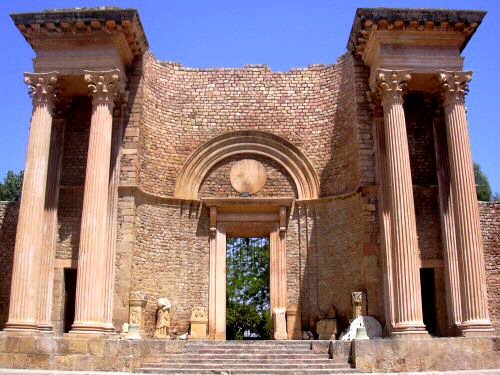
Annaba
Annaba /ˈænəbə/, US /əˈnɑːbə/ (Arabic: عنابة, ‘Annābah, formerly Bône or Bona, historically Hippo or Hippo Regius) is a city in the north-eastern corner of Algeria near the Seybouse River. It is located in Annaba Province. With a population of 257,3..
Annaba Wikipedia Page


About Our Data
The data on this page is estimated using a number of publicly available tools and resources. It is provided without warranty, and could contain inaccuracies. Use at your own risk.