Categories in Djamaa
Industries
Business Distribution by Industry in Djamaa
| Industry Description | Number of Establishments |
|---|---|
| Shopping | 36 |
| Education | 25 |
| Mosques | 21 |
| Apartments | 18 |
| Pharmacies and drug stores | 14 |
| Electronics stores | 13 |
| Religion | 12 |
| Cafes | 11 |
| Public administration | 11 |
| Clothing stores | 10 |
| Hospitals | 10 |
Djamaa Facts
| Area | 561.8 km² |
| Population | 73,244 |
| Male Population | 36,586 (50.0%) |
| Female Population | 36,658 (50.0%) |
| Population change (1975 to 2020) | +541.1% |
| Population change (2000 to 2020) | +76.4% |
| Median Age | 22.3 years (Male: 21.8, Female: 22.9) |
| GDP per capita (PPP) | $8,533 (2022) |
| Local Time | |
| Timezone | Central European Standard Time |
| Lat & Lng | 33.53388, 5.99306 |
| Postal Codes | 39004 |
Map of Djamaa
Interactive Map
Djamaa Population
Years 1975 to 2030
| Data | 1975 | 1990 | 2000 | 2015 | 2020 | 2025* | 2030* |
|---|---|---|---|---|---|---|---|
| Population | 11,424 | 28,659 | 41,513 | 64,020 | 73,244 | 81,716 | 89,155 |
| Population Density | 20.3 / km² | 51 / km² | 73.9 / km² | 114 / km² | 130.4 / km² | 145.5 / km² | 158.7 / km² |
Djamaa Population change from 2000 to 2020
Increase of 76.4% from year 2000 to 2020
| Location | Change since 1975 | Change since 1990 | Change since 2000 |
|---|---|---|---|
| Djamaa | +541.1% | +155.6% | +76.4% |
| Ouargla Province | — | — | — |
| Algeria | — | — | — |
Djamaa Median Age
Median Age: 22.3 years
| Location | Median Age | Median Age (Female) | Median Age (Male) |
|---|---|---|---|
| Djamaa | 22.3 yrs | 22.9 yrs | 21.8 yrs |
| Ouargla Province | 21.6 yrs | 21.7 yrs | 21.5 yrs |
| Algeria | 25.1 yrs | 25.3 yrs | 24.9 yrs |
Djamaa Population Density
Population Density: 130 / km²
| Location | Population | Area | Density |
|---|---|---|---|
| Djamaa | 73,244 | 561.8 km² | 130 / km² |
| Ouargla Province | 679,820 | 211,120.9 km² | 3.2 / km² |
| Algeria | 39.5 million | 2,312,254.9 km² | 17.1 / km² |
Djamaa Historical and Projected Population
Estimated Population from 1770 to 2100
- JRC (European Commission's Joint Research Centre) work on the GHS built-up grid
- CIESIN (Center for International Earth Science Information Network)
- [Link] Klein Goldewijk, K., Beusen, A., Doelman, J., and Stehfest, E.: Anthropogenic land use estimates for the Holocene – HYDE 3.2, Earth Syst. Sci. Data, 9, 927–953, https://doi.org/10.5194/essd-9-927-2017, 2017.
Area Codes
Percentage Area Codes used by businesses in Djamaa
Human Development Index (HDI)
Statistic composite index of life expectancy, education, and per capita income.
Djamaa Gross Domestic Product (GDP)
GDP per capita, PPP (constant 2017 international $)
| Data | 1990 | 1995 | 2000 | 2005 | 2010 | 2015 | 2020 | 2022 |
|---|---|---|---|---|---|---|---|---|
| GDP per capita | $5,647 | $5,399 | $6,551 | $8,106 | $8,592 | $9,188 | $7,936 | $8,533 |
| Total GDP | $174.1M | $196.8M | $273.6M | $390.6M | $483.3M | $605.1M | $602.2M | $676.9M |
Djamaa CO2 Emissions
Carbon Dioxide (CO2) Emissions Per Capita in Tonnes Per Year
| Location | CO2 Emissions | CO2 Emissions Per Capita | CO2 Emissions Intensity |
|---|---|---|---|
| Djamaa | 131,284 tn | 1.79 tn | 233.7 tons/km² |
| Ouargla Province | 1,278,611 tn | 1.88 tn | 6.1 tons/km² |
| Algeria | 69,721,458 tn | 1.77 tn | 30.2 tons/km² |
| 2013 CO2 emissions (tonnes/year) | 131,284 tn |
| 2013 CO2 emissions (tonnes/year) per capita | 1.79 tn |
| 2013 CO2 emissions intensity (tonnes/km²/year) | 233.7 tons/km² |
Djamaa
Djamaa (Arabic: ﺟﺎﻣﻌﺔ) (also written Jama'a) is a town and commune in El Oued Province, Algeria. According to the 2008 census it has a population of 50,916, up from 37,438 in 1998, with an annual growth rate of 3.1%.
Djamaa Wikipedia Page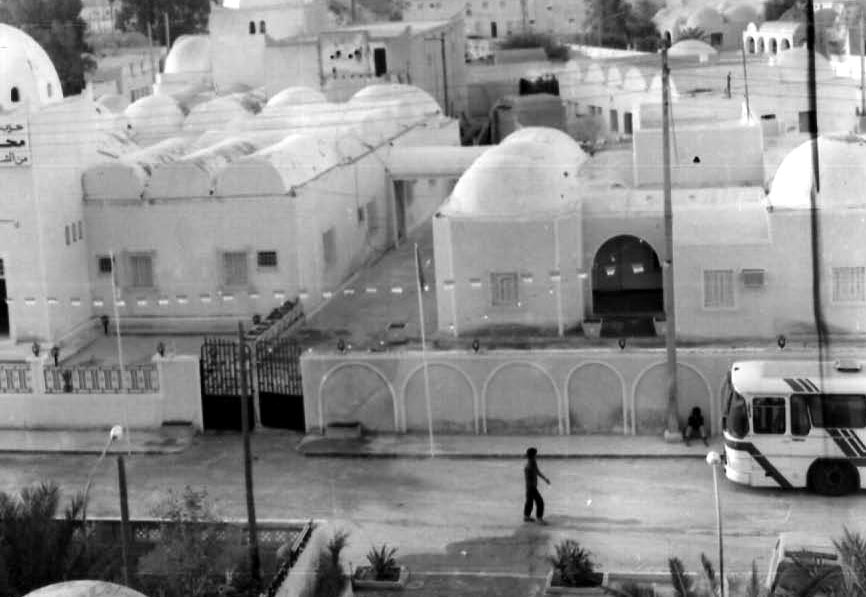


About Our Data
The data on this page is estimated using a number of publicly available tools and resources. It is provided without warranty, and could contain inaccuracies. Use at your own risk.