Categories in Ghardaïa
Industries
Business Distribution by Industry in Ghardaïa
| Industry Description | Number of Establishments | Average Google Rating |
|---|---|---|
| Education | 76 | 3.7 |
| Religion | 63 | 4.3 |
| Mosques | 61 | 4.3 |
| Shopping | 60 | 4 |
| Health and medical | 16 | 4.2 |
| Hotels and motels | 14 | 3.4 |
| Primary and elementary schools | 14 | 3.4 |
| Travel agencies | 13 | 3.8 |
| Gas station | 12 | 3.7 |
| Other accommodation | 11 | 3.3 |
| Public administration | 10 | 3.5 |
| Hospitals | 9 | 4.1 |
| Cemeteries and crematoriums | 9 | 3.7 |
| Department stores | 7 | 3.4 |
| All food and beverage | 7 | 3.8 |
| Pharmacies and drug stores | 5 | 4.3 |
| Secondary education | 5 | 4 |
| Loan companies | 5 | 3.4 |
| Banks | 5 | 3.6 |
Ghardaïa Facts
| Area | 296.8 km² |
| Population | 108,125 |
| Male Population | 55,121 (51.0%) |
| Female Population | 53,004 (49.0%) |
| Population change (1975 to 2020) | +130.2% |
| Population change (2000 to 2020) | +14.9% |
| Median Age | 22.6 years (Male: 22.3, Female: 23) |
| Area Codes | 29 |
| Neighborhoods | Quartier Teniet-El-Makhzen, Hadj Messaoud, حي سيدي اعباز, Beni Isguen, Quartier Ben Smara |
| Local Time | |
| Timezone | Central European Standard Time |
| Lat & Lng | 32.49094, 3.67347 |
Map of Ghardaïa
Interactive Map
Ghardaïa Population
Years 1975 to 2020
| Data | 1975 | 1990 | 2000 | 2015 | 2020 |
|---|---|---|---|---|---|
| Population | 46,970 | 82,048 | 94,064 | 101,481 | 108,125 |
| Population Density | 158.2 / km² | 276.4 / km² | 316.9 / km² | 341.9 / km² | 364.3 / km² |
Ghardaïa Population change from 2000 to 2015
Increase of 7.9% from year 2000 to 2015
| Location | Change since 1975 | Change since 1990 | Change since 2000 |
|---|---|---|---|
| Ghardaïa | +116.1% | +23.7% | +7.9% |
| Ghardaïa Province | +241.2% | +66.6% | +30.3% |
| Algeria | +137.8% | +53.3% | +27.3% |
Ghardaïa Median Age
Median Age: 22.6 years
| Location | Median Age | Median Age (Female) | Median Age (Male) |
|---|---|---|---|
| Ghardaïa | 22.6 yrs | 23 yrs | 22.3 yrs |
| Ghardaïa Province | 22.4 yrs | 22.6 yrs | 22.2 yrs |
| Algeria | 25.1 yrs | 25.3 yrs | 24.9 yrs |
Ghardaïa Population Density
Population Density: 364 / km²
| Location | Population | Area | Density |
|---|---|---|---|
| Ghardaïa | 108,125 | 296.8 km² | 364 / km² |
| Ghardaïa Province | 423,206 | 75,473.7 km² | 5.6 / km² |
| Algeria | 39.5 million | 2,312,254.9 km² | 17.1 / km² |
Ghardaïa Historical and Projected Population
Estimated Population from 1600 to 2100
- JRC (European Commission's Joint Research Centre) work on the GHS built-up grid
- CIESIN (Center for International Earth Science Information Network)
- [Link] Klein Goldewijk, K., Beusen, A., Doelman, J., and Stehfest, E.: Anthropogenic land use estimates for the Holocene – HYDE 3.2, Earth Syst. Sci. Data, 9, 927–953, https://doi.org/10.5194/essd-9-927-2017, 2017.
Neighborhoods in Ghardaïa
Percentage of businesses by neighborhood in Ghardaïa
Area Codes
Percentage Area Codes used by businesses in Ghardaïa
Human Development Index (HDI)
Statistic composite index of life expectancy, education, and per capita income.
Ghardaïa CO2 Emissions
Carbon Dioxide (CO2) Emissions Per Capita in Tonnes Per Year
| Location | CO2 Emissions | CO2 Emissions Per Capita | CO2 Emissions Intensity |
|---|---|---|---|
| Ghardaïa | 207,216 tn | 1.92 tn | 698.1 tons/km² |
| Ghardaïa Province | 814,191 tn | 1.92 tn | 10.8 tons/km² |
| Algeria | 69,721,458 tn | 1.77 tn | 30.2 tons/km² |
| 2013 CO2 emissions (tonnes/year) | 207,216 tn |
| 2013 CO2 emissions (tonnes/year) per capita | 1.92 tn |
| 2013 CO2 emissions intensity (tonnes/km²/year) | 698.1 tons/km² |
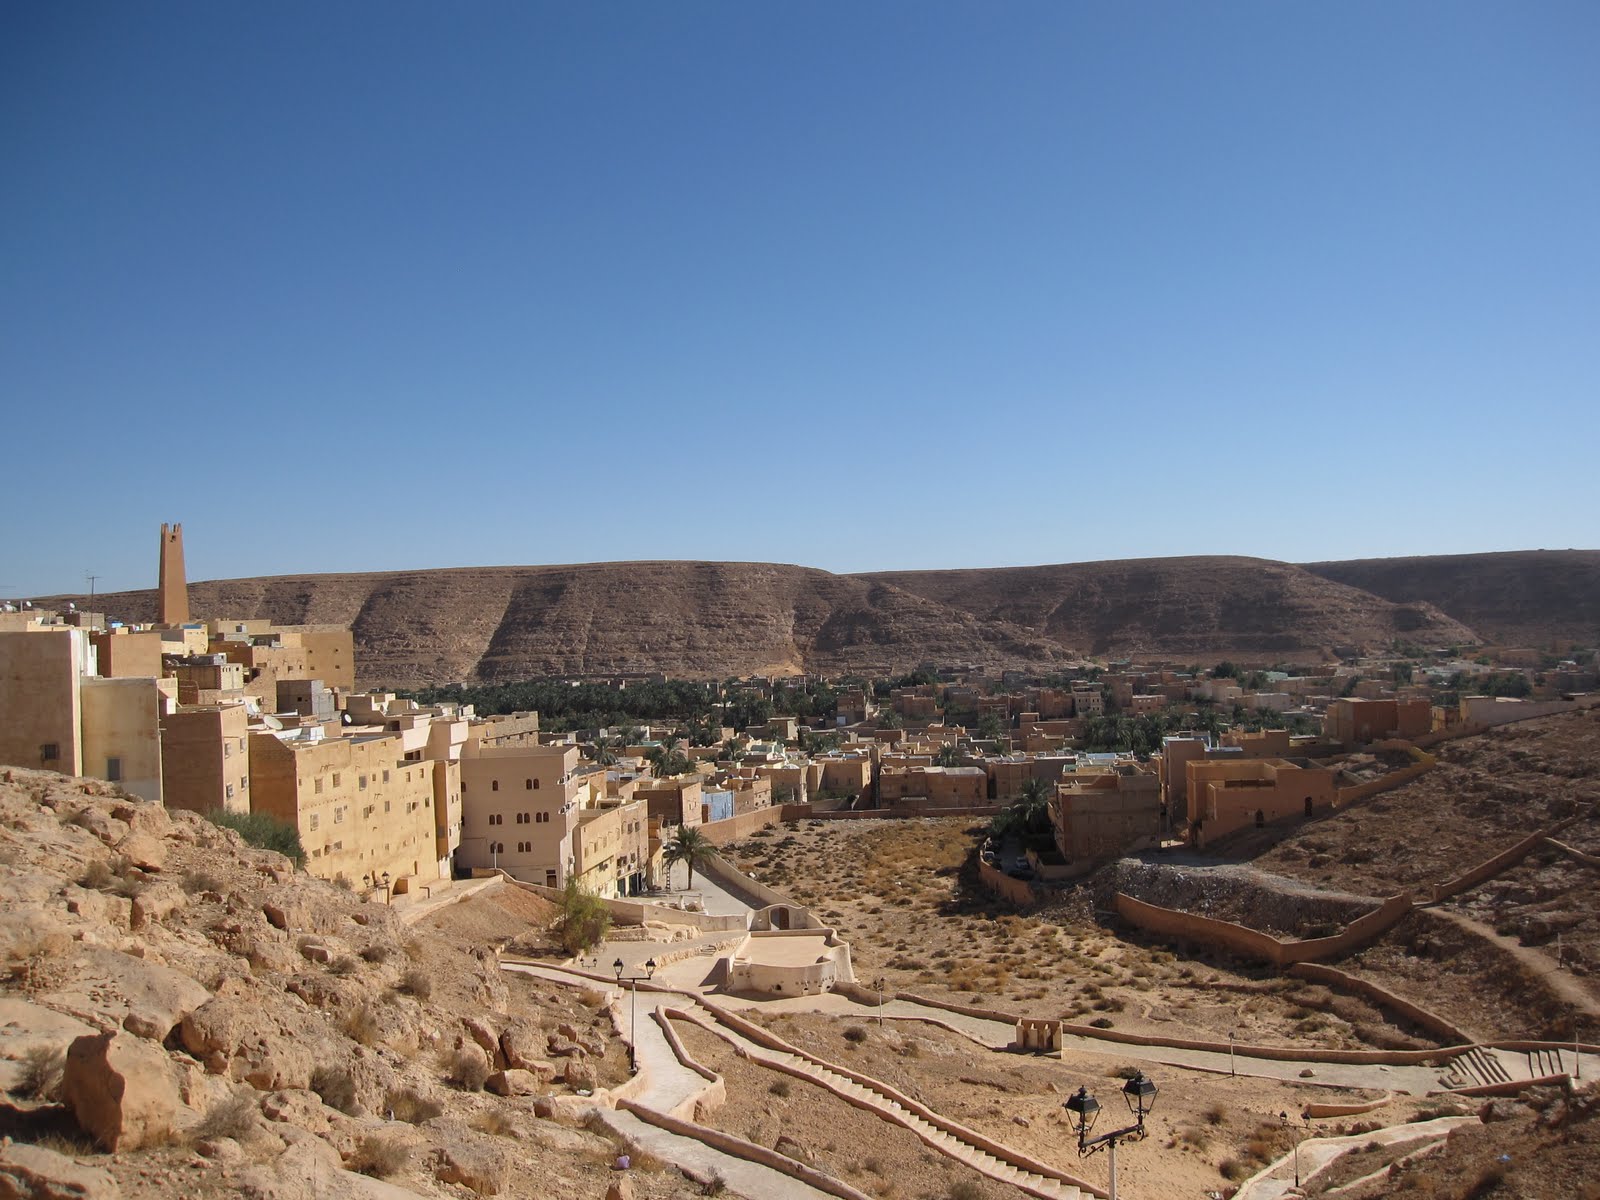
Ghardaïa
Ghardaïa (Arabic: غرداية , Mzab-Berber: Ɣerdayt, Taɣerdayt, ⵜⴰⵖⴻⵔⴷⴰⵢⵜ) is the capital city of Ghardaïa Province, Algeria. The commune of Ghardaïa has a population of 93,423 according to the 2008 census, up from 87,599 in 1998, with an annual growth r..
Ghardaïa Wikipedia Page

About Our Data
The data on this page is estimated using a number of publicly available tools and resources. It is provided without warranty, and could contain inaccuracies. Use at your own risk.