Categories in Naâma
Naâma Facts
| Area | 2404.3 km² |
| Population | 28,217 |
| Male Population | 14,274 (50.6%) |
| Female Population | 13,943 (49.4%) |
| Population change (1975 to 2020) | +2520.0% |
| Population change (2000 to 2020) | +186.5% |
| Median Age | 22.2 years (Male: 21.9, Female: 22.5) |
| Area Codes | 49 |
| Local Time | |
| Timezone | Central European Standard Time |
| Lat & Lng | 33.26667, -0.31667 |
| Postal Codes | 45000, 45006 |
Map of Naâma
Interactive Map
Naâma Population
Years 1975 to 2020
| Data | 1975 | 1990 | 2000 | 2015 | 2020 |
|---|---|---|---|---|---|
| Population | 1,077 | 4,696 | 9,849 | 26,453 | 28,217 |
| Population Density | 0.4 / km² | 2 / km² | 4.1 / km² | 11 / km² | 11.7 / km² |
Naâma Population change from 2000 to 2015
Increase of 168.6% from year 2000 to 2015
| Location | Change since 1975 | Change since 1990 | Change since 2000 |
|---|---|---|---|
| Naâma | +2356.2% | +463.3% | +168.6% |
| Naâma Province | +659.8% | +195% | +90.6% |
| Algeria | +137.8% | +53.3% | +27.3% |
Naâma Median Age
Median Age: 22.2 years
| Location | Median Age | Median Age (Female) | Median Age (Male) |
|---|---|---|---|
| Naâma | 22.2 yrs | 22.5 yrs | 21.9 yrs |
| Naâma Province | 24.3 yrs | 24.2 yrs | 24.4 yrs |
| Algeria | 25.1 yrs | 25.3 yrs | 24.9 yrs |
Naâma Population Density
Population Density: 11.7 / km²
| Location | Population | Area | Density |
|---|---|---|---|
| Naâma | 28,217 | 2,404.3 km² | 11.7 / km² |
| Naâma Province | 276,327 | 30,769 km² | 9 / km² |
| Algeria | 39.5 million | 2,312,254.9 km² | 17.1 / km² |
Naâma Historical and Projected Population
Estimated Population from 1970 to 2100
- JRC (European Commission's Joint Research Centre) work on the GHS built-up grid
- CIESIN (Center for International Earth Science Information Network)
- [Link] Klein Goldewijk, K., Beusen, A., Doelman, J., and Stehfest, E.: Anthropogenic land use estimates for the Holocene – HYDE 3.2, Earth Syst. Sci. Data, 9, 927–953, https://doi.org/10.5194/essd-9-927-2017, 2017.
Human Development Index (HDI)
Statistic composite index of life expectancy, education, and per capita income.
Naâma CO2 Emissions
Carbon Dioxide (CO2) Emissions Per Capita in Tonnes Per Year
| Location | CO2 Emissions | CO2 Emissions Per Capita | CO2 Emissions Intensity |
|---|---|---|---|
| Naâma | 51,452 tn | 1.82 tn | 21.4 tons/km² |
| Naâma Province | 504,733 tn | 1.83 tn | 16.4 tons/km² |
| Algeria | 69,721,458 tn | 1.77 tn | 30.2 tons/km² |
| 2013 CO2 emissions (tonnes/year) | 51,452 tn |
| 2013 CO2 emissions (tonnes/year) per capita | 1.82 tn |
| 2013 CO2 emissions intensity (tonnes/km²/year) | 21.4 tons/km² |
Recent Nearby Earthquakes
Magnitude 3.0 and greater
| Date▼ | Time↕ | Magnitude↕ | Distance↕ | Depth↕ | Location↕ | Link |
|---|---|---|---|---|---|---|
| 12/14/09 | 6:41 AM | 4.9 | 50.3 km | 10,000 m | northern Algeria | usgs.gov |
| 3/24/92 | 10:45 AM | 3.7 | 37.4 km | 10,000 m | northern Algeria | usgs.gov |
| 12/11/78 | 8:56 AM | 4.9 | 47.7 km | 10,000 m | northern Algeria | usgs.gov |
Naâma
Naâma (Arabic: النعامة or نعامة) is a municipality in Naâma Province, Algeria, of which it is the province seat. It is coextensive with the district of Naâma and has a population of 8,256, (in 1998) which gives it 7 seats in the PMA. Its population i..
Naâma Wikipedia Page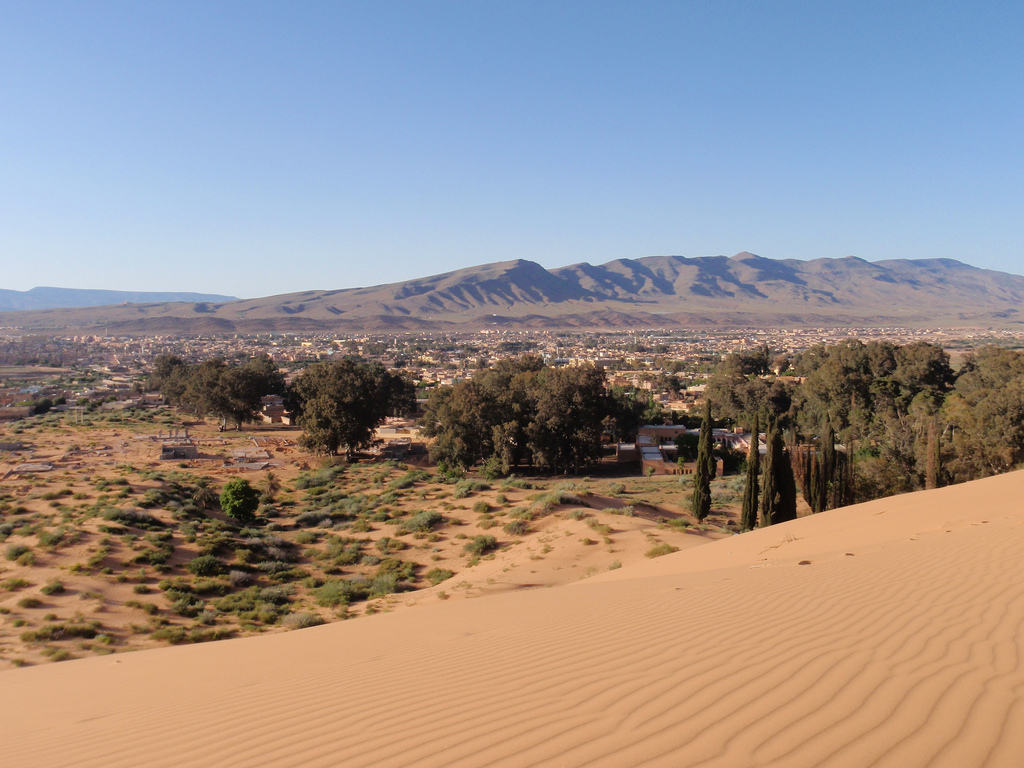

About Our Data
The data on this page is estimated using a number of publicly available tools and resources. It is provided without warranty, and could contain inaccuracies. Use at your own risk.