Categories in Harku
Harku Facts
| Area | 251.1 km² |
| Population | 19,041 |
| Male Population | 9,272 (48.7%) |
| Female Population | 9,769 (51.3%) |
| Population change (1975 to 2020) | +111905.9% |
| Population change (2000 to 2020) | +167.2% |
| Median Age | 35.9 years (Male: 35.3, Female: 36.5) |
| Neighborhoods | Suurupi, Rannamõisa, Laagri, Adra, Vanalinn |
| Local Time | |
| Timezone | Eastern European Summer Time |
| Lat & Lng | 59.38528, 24.57750 |
| Postal Codes | 76924, 76991, 76992 |
Map of Harku
Interactive Map
Harku Population
Years 1975 to 2020
| Data | 1975 | 1990 | 2000 | 2015 | 2020 |
|---|---|---|---|---|---|
| Population | 17 | 2,175 | 7,125 | 19,119 | 19,041 |
| Population Density | 0.1 / km² | 8.7 / km² | 28.4 / km² | 76.2 / km² | 75.8 / km² |
Harku Population change from 2000 to 2015
Increase of 168.3% from year 2000 to 2015
| Location | Change since 1975 | Change since 1990 | Change since 2000 |
|---|---|---|---|
| Harku | +112364.7% | +779% | +168.3% |
| Harju County | +11834.4% | +108.9% | +15.1% |
| Estonia | -1.7% | -13.7% | -5.9% |
Harku Median Age
Median Age: 35.9 years
| Location | Median Age | Median Age (Female) | Median Age (Male) |
|---|---|---|---|
| Harku | 35.9 yrs | 36.5 yrs | 35.3 yrs |
| Harju County | 38.4 yrs | 41.2 yrs | 35.7 yrs |
| Estonia | 40.9 yrs | 44.3 yrs | 37.4 yrs |
Harku Population Density
Population Density: 75.8 / km²
| Location | Population | Area | Density |
|---|---|---|---|
| Harku | 19,041 | 251.1 km² | 75.8 / km² |
| Harju County | 579,298 | 4,281.2 km² | 135 / km² |
| Estonia | 1.3 million | 45,265.4 km² | 28.6 / km² |
Harku Historical and Projected Population
Estimated Population from 1975 to 2100
- JRC (European Commission's Joint Research Centre) work on the GHS built-up grid
- CIESIN (Center for International Earth Science Information Network)
- [Link] Klein Goldewijk, K., Beusen, A., Doelman, J., and Stehfest, E.: Anthropogenic land use estimates for the Holocene – HYDE 3.2, Earth Syst. Sci. Data, 9, 927–953, https://doi.org/10.5194/essd-9-927-2017, 2017.
Neighborhoods in Harku
Percentage of businesses by neighborhood in Harku
Area Codes
Percentage Area Codes used by businesses in Harku
Postal Codes
Percentage of businesses by Postal Codes in Harku
Human Development Index (HDI)
Statistic composite index of life expectancy, education, and per capita income.
Harku CO2 Emissions
Carbon Dioxide (CO2) Emissions Per Capita in Tonnes Per Year
| Location | CO2 Emissions | CO2 Emissions Per Capita | CO2 Emissions Intensity |
|---|---|---|---|
| Harku | 193,144 tn | 10.14 tn | 769.3 tons/km² |
| Harju County | 5,859,910 tn | 10.12 tn | 1,368.8 tons/km² |
| Estonia | 11,346,165 tn | 8.75 tn | 250.7 tons/km² |
| 2013 CO2 emissions (tonnes/year) | 193,144 tn |
| 2013 CO2 emissions (tonnes/year) per capita | 10.14 tn |
| 2013 CO2 emissions intensity (tonnes/km²/year) | 769.3 tons/km² |
Recent Nearby Earthquakes
Magnitude 3.0 and greater
| Date▼ | Time↕ | Magnitude↕ | Distance↕ | Depth↕ | Location↕ | Link |
|---|---|---|---|---|---|---|
| 10/25/76 | 8:39 AM | 4.5 | 54.9 km | 33,000 m | Estonia | usgs.gov |
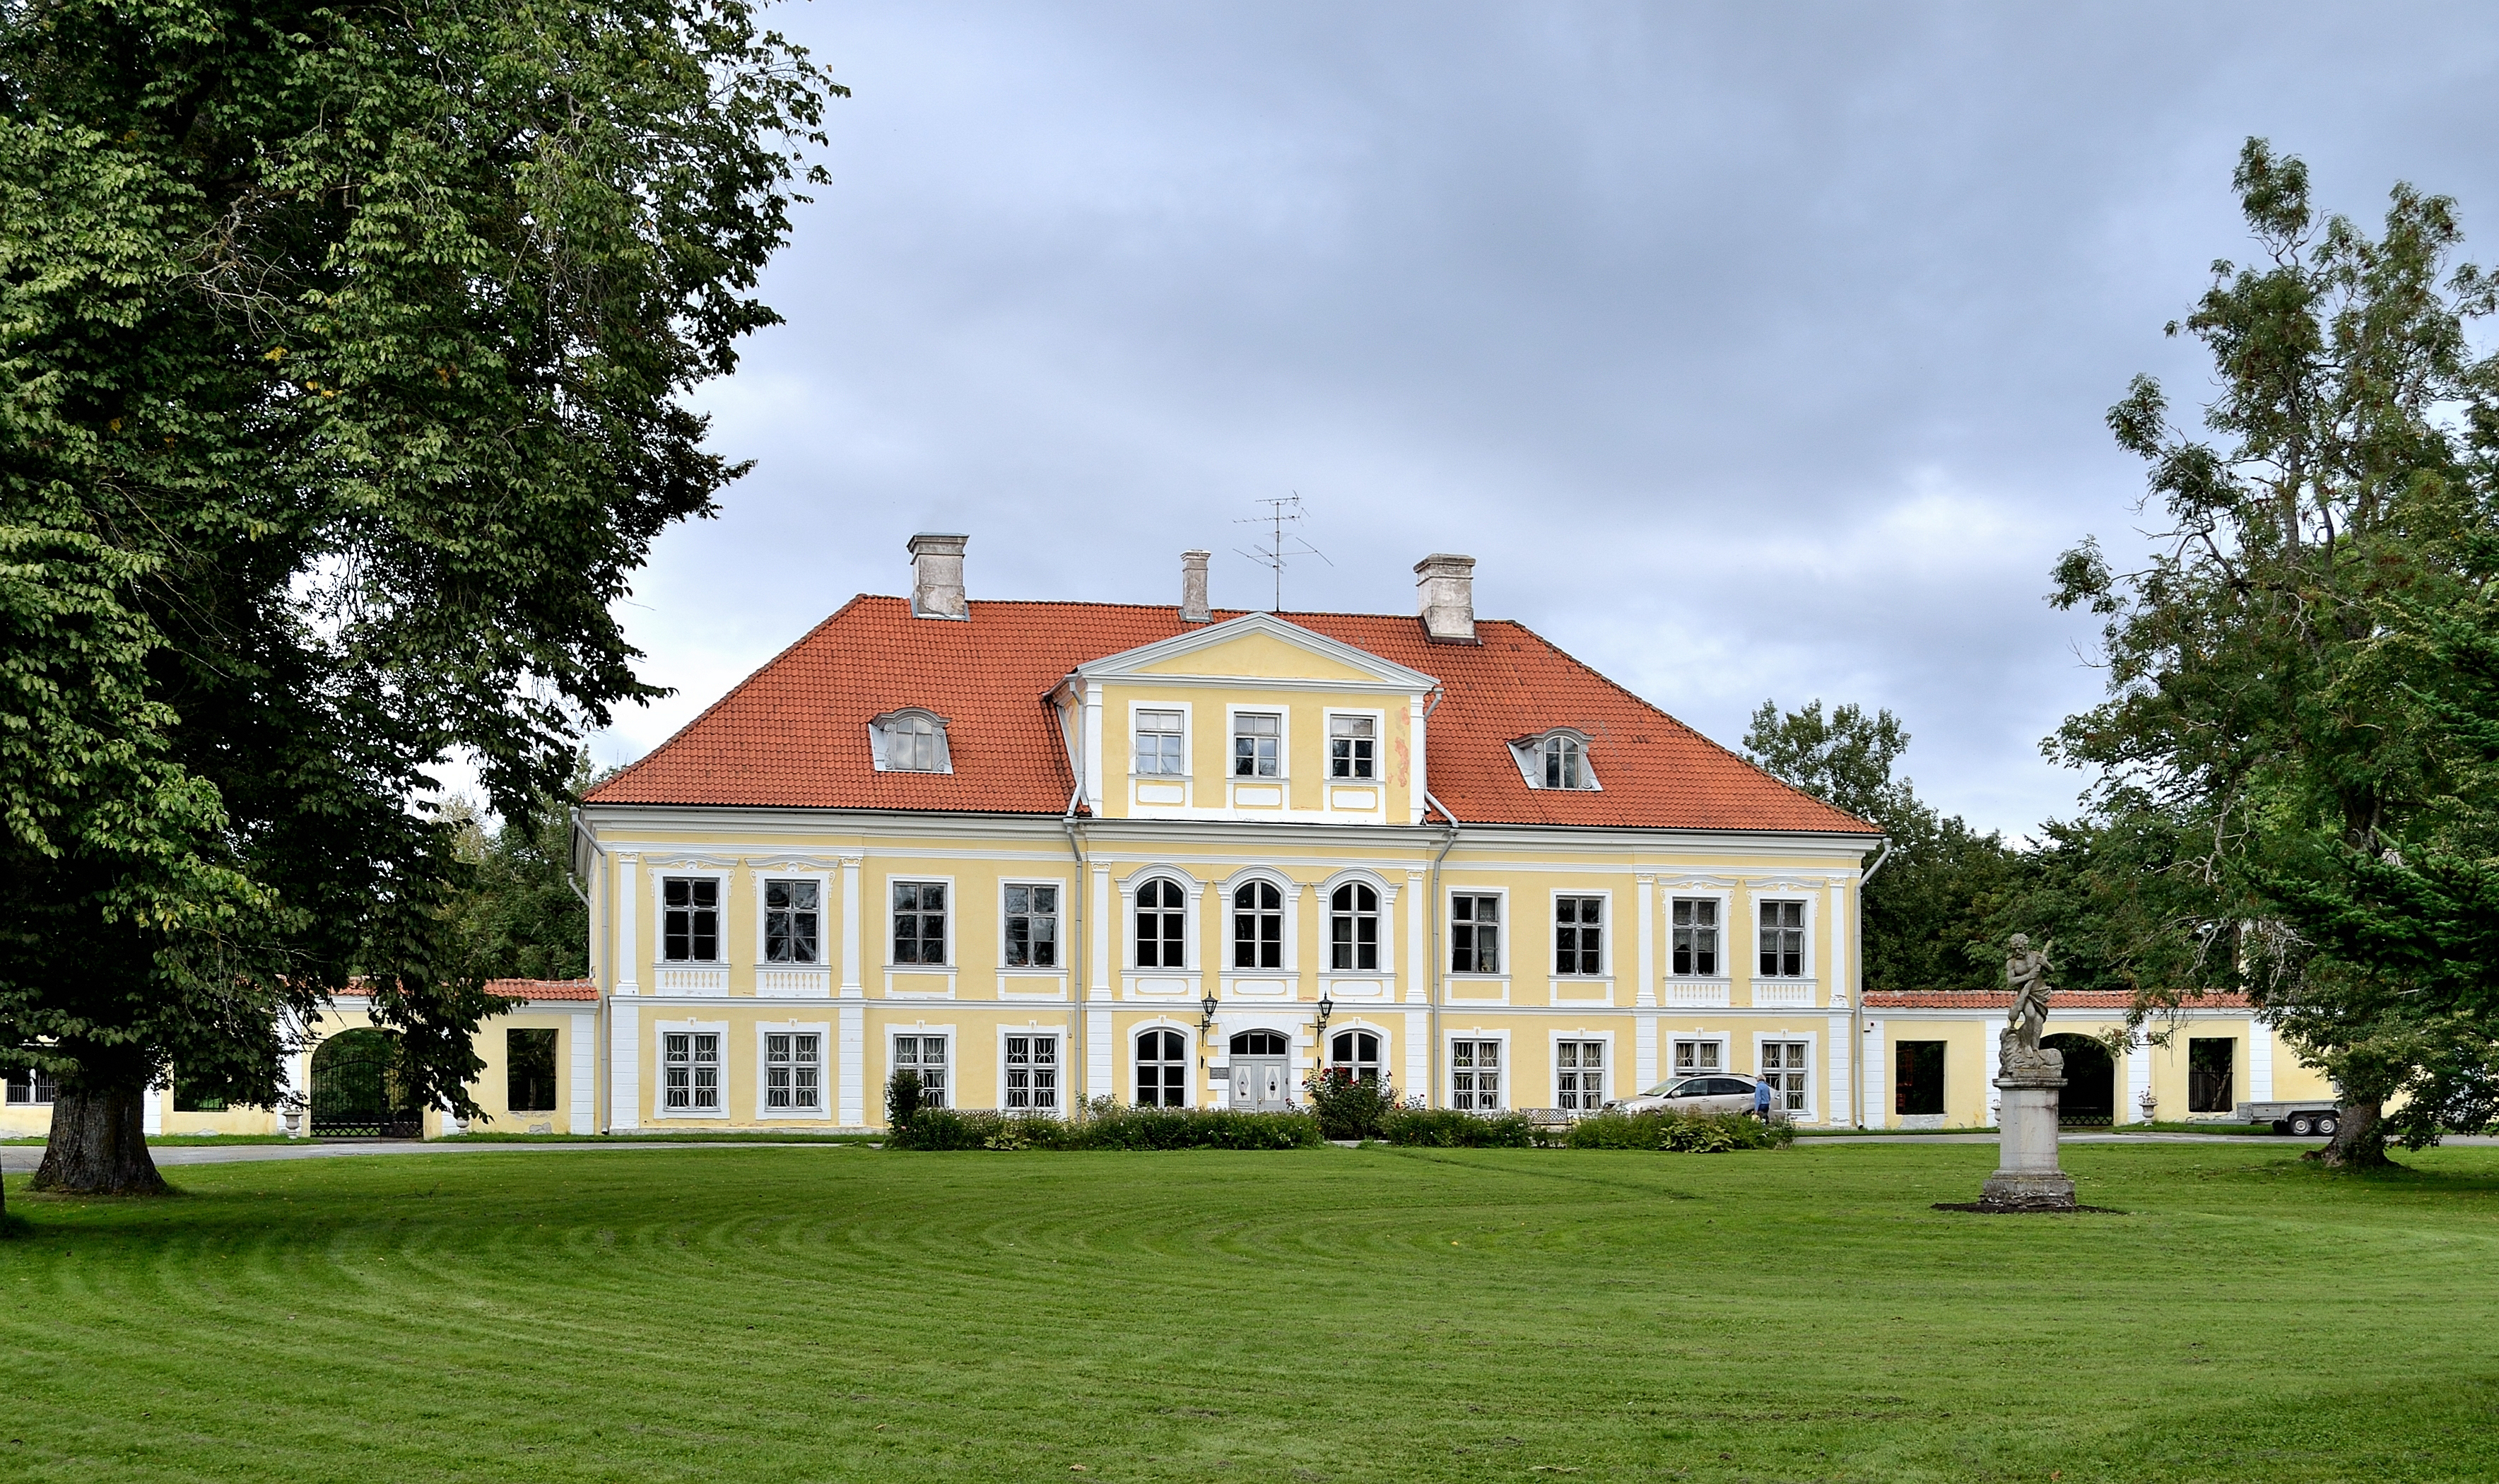
Harku
Harku (German: Hark) is a small borough (Estonian: alevik) in Harku Parish, Harju County, northern Estonia. As of 2011 Census, the settlement's population was 868, of which the Estonians were 539 (62.1%). was first mentioned probably in 1242 as Hark..
Harku Wikipedia Page


About Our Data
The data on this page is estimated using a number of publicly available tools and resources. It is provided without warranty, and could contain inaccuracies. Use at your own risk.