Categories in Puhja
Puhja Facts
| Area | 1.1 km² |
| Population | 691 |
| Male Population | 331 (47.9%) |
| Female Population | 360 (52.1%) |
| Population change (1975 to 2020) | +5215.4% |
| Population change (2000 to 2020) | -36.1% |
| Median Age | 40.8 years (Male: 36.6, Female: 45.8) |
| Neighborhoods | Ulila |
| Local Time | |
| Timezone | Eastern European Summer Time |
| Lat & Lng | 58.34194, 26.31472 |
| Postal Codes | 61301, 61308, 61321 |
Map of Puhja
Interactive Map
Puhja Population
Years 1975 to 2030
| Data | 1975 | 1990 | 2000 | 2015 | 2020 | 2025* | 2030* |
|---|---|---|---|---|---|---|---|
| Population | 13 | 666 | 1,082 | 966 | 691 | 685 | 673 |
| Population Density | 12.2 / km² | 626.8 / km² | 1,018.4 / km² | 909.2 / km² | 650.4 / km² | 644.7 / km² | 633.4 / km² |
Puhja Population change from 2000 to 2020
Decrease of 36.1% from year 2000 to 2020
| Location | Change since 1975 | Change since 1990 | Change since 2000 |
|---|---|---|---|
| Puhja | +5215.4% | +3.8% | -36.1% |
| Tartu County | — | — | — |
| Estonia | — | — | — |
Puhja Median Age
Median Age: 40.8 years
| Location | Median Age | Median Age (Female) | Median Age (Male) |
|---|---|---|---|
| Puhja | 40.8 yrs | 45.8 yrs | 36.6 yrs |
| Tartu County | 36.3 yrs | 38.9 yrs | 33.8 yrs |
| Estonia | 40.9 yrs | 44.3 yrs | 37.4 yrs |
Puhja Population Density
Population Density: 650 / km²
| Location | Population | Area | Density |
|---|---|---|---|
| Puhja | 691 | 1.063 km² | 650 / km² |
| Tartu County | 151,390 | 2,987.7 km² | 50.7 / km² |
| Estonia | 1.3 million | 45,265.4 km² | 28.6 / km² |
Puhja Historical and Projected Population
Estimated Population from 1850 to 2100
- JRC (European Commission's Joint Research Centre) work on the GHS built-up grid
- CIESIN (Center for International Earth Science Information Network)
- [Link] Klein Goldewijk, K., Beusen, A., Doelman, J., and Stehfest, E.: Anthropogenic land use estimates for the Holocene – HYDE 3.2, Earth Syst. Sci. Data, 9, 927–953, https://doi.org/10.5194/essd-9-927-2017, 2017.
Area Codes
Percentage Area Codes used by businesses in Puhja
Human Development Index (HDI)
Statistic composite index of life expectancy, education, and per capita income.
Puhja CO2 Emissions
Carbon Dioxide (CO2) Emissions Per Capita in Tonnes Per Year
| Location | CO2 Emissions | CO2 Emissions Per Capita | CO2 Emissions Intensity |
|---|---|---|---|
| Puhja | 6,113 tn | 8.85 tn | 5,753.2 tons/km² |
| Tartu County | 1,338,874 tn | 8.84 tn | 448.1 tons/km² |
| Estonia | 11,346,165 tn | 8.75 tn | 250.7 tons/km² |
| 2013 CO2 emissions (tonnes/year) | 6,113 tn |
| 2013 CO2 emissions (tonnes/year) per capita | 8.85 tn |
| 2013 CO2 emissions intensity (tonnes/km²/year) | 5,753.2 tons/km² |
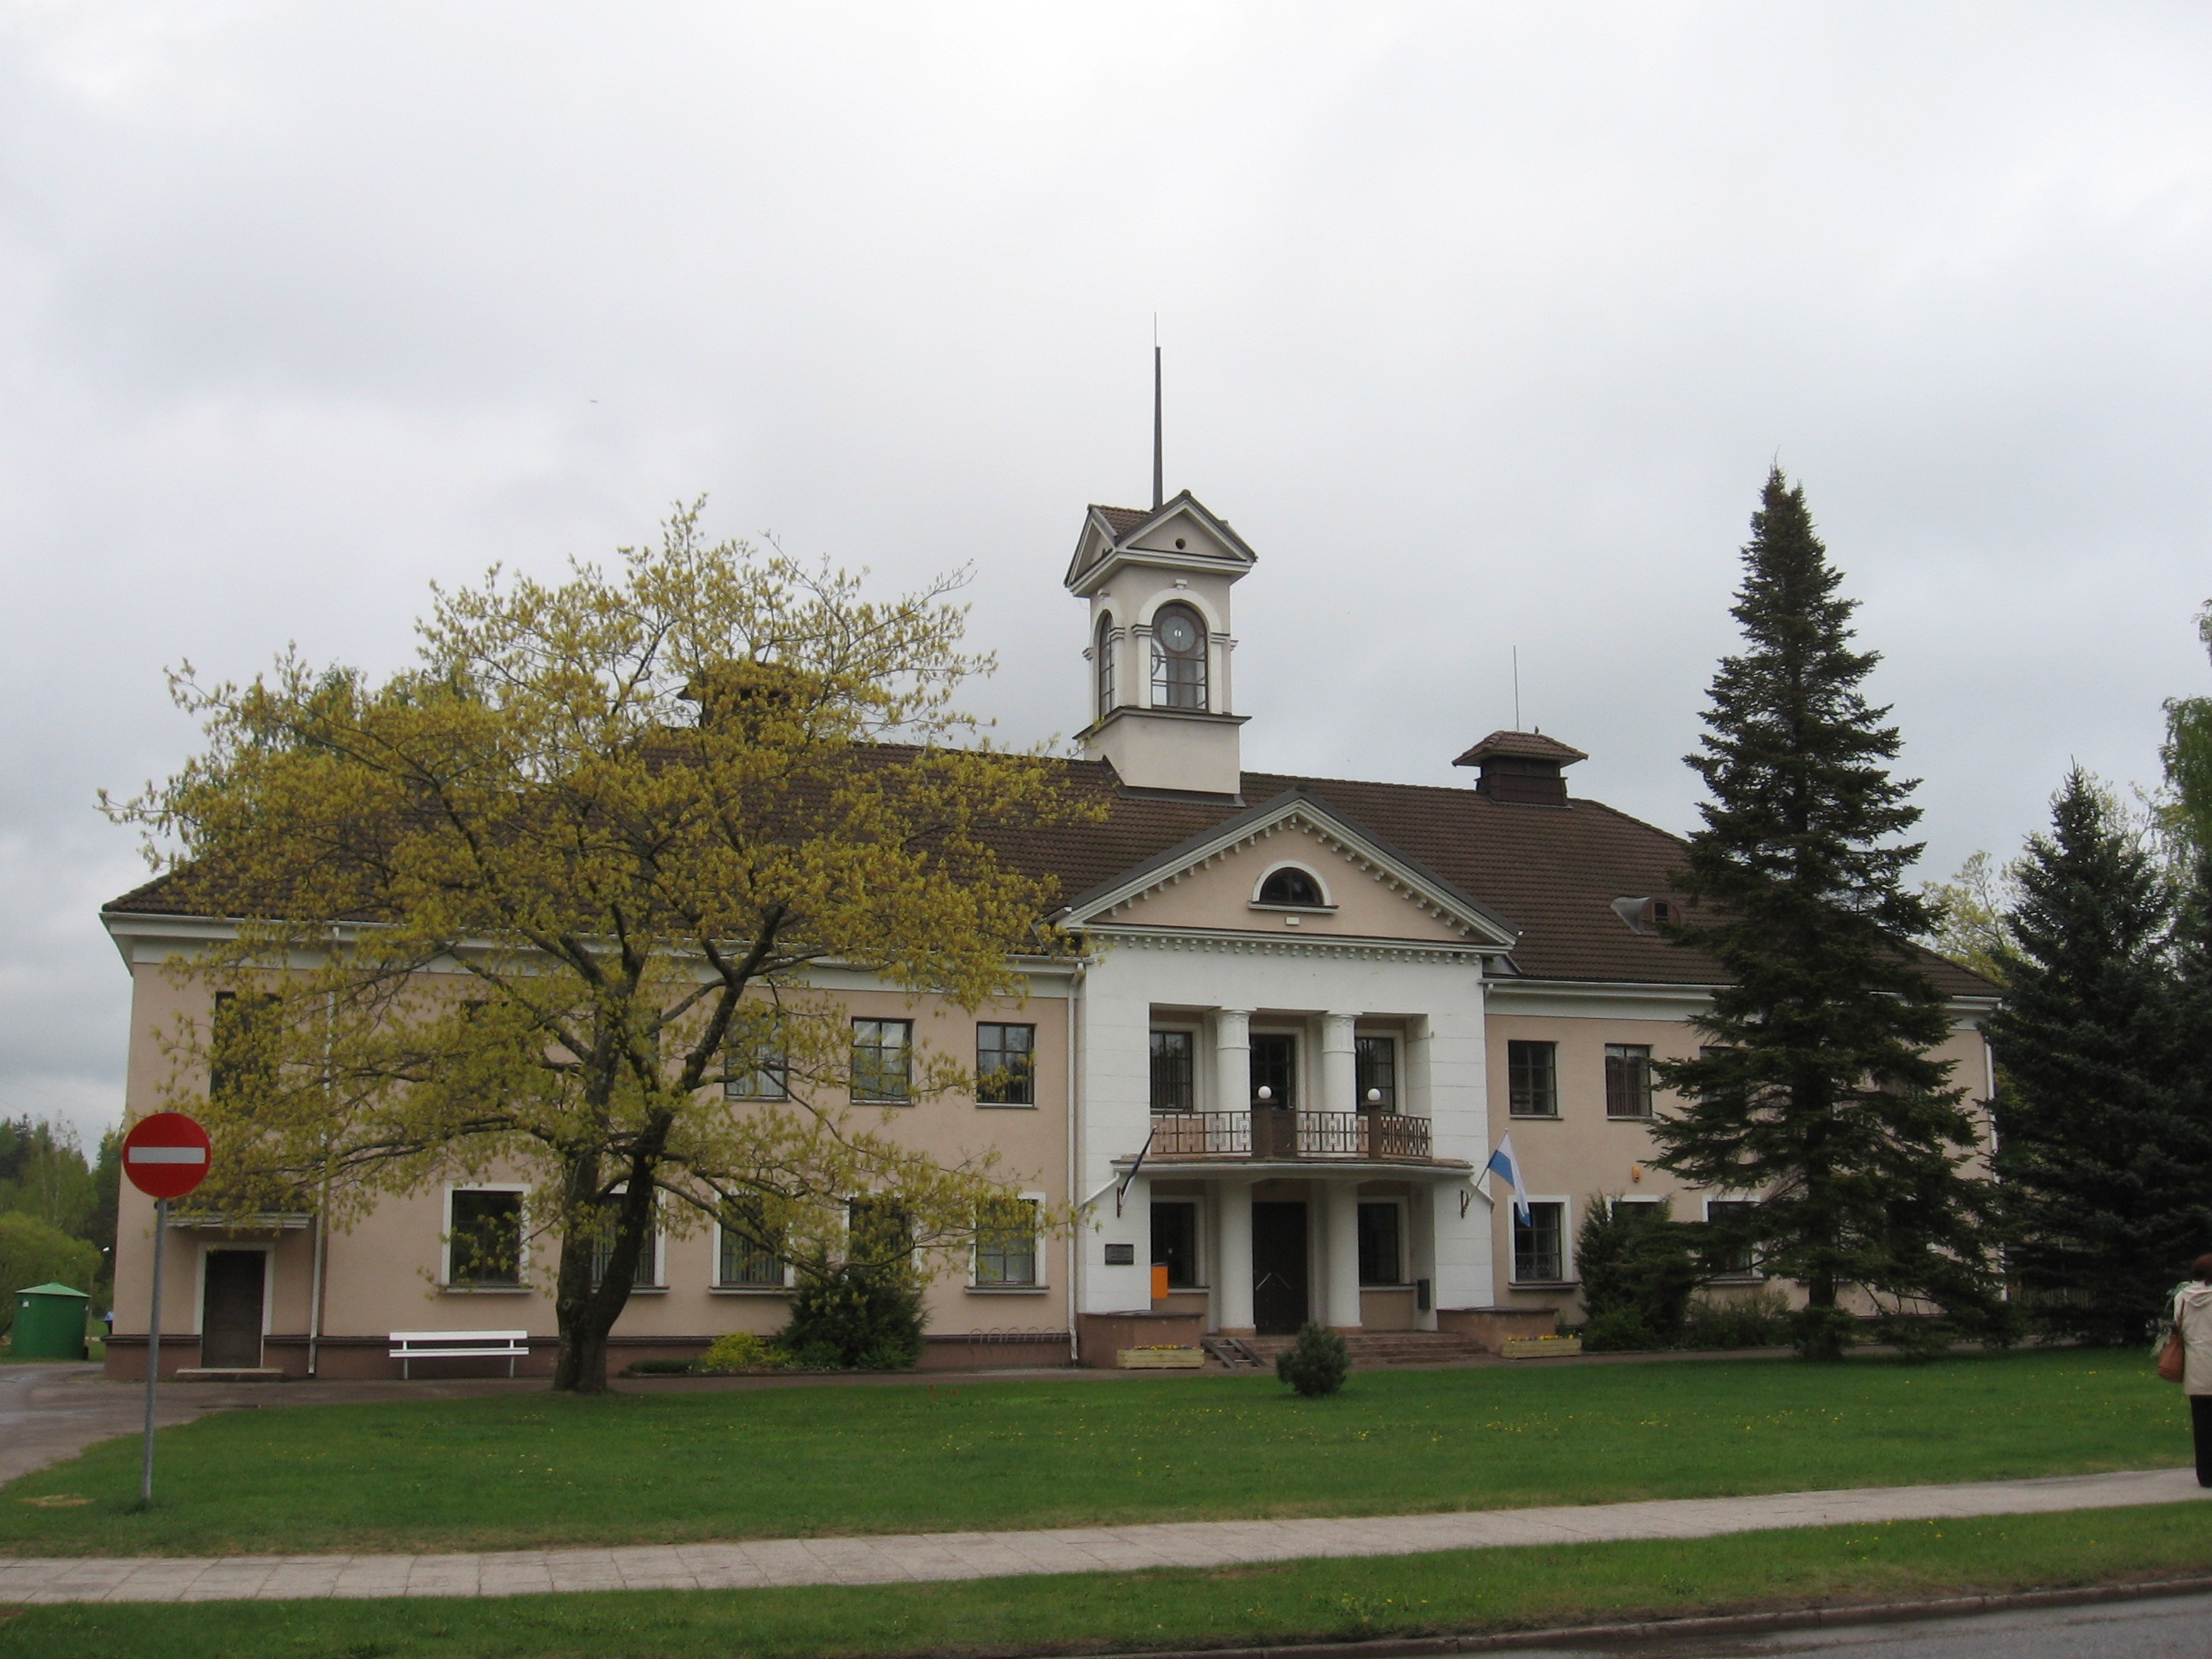
Puhja
Puhja is a small borough (Estonian: alevik) in Tartu County, Estonia. It is the administrative centre of Puhja Parish. Puhja has a population of 981 (as of 1 January 2010). church, originally dedicated to St. Dionysius, dates from the mid-14th centu..
Puhja Wikipedia Page


About Our Data
The data on this page is estimated using a number of publicly available tools and resources. It is provided without warranty, and could contain inaccuracies. Use at your own risk.