Categories in Bailén
Industries
Business Distribution by Industry in Bailén
| Industry Description | Number of Establishments |
|---|---|
| Shopping | 70 |
| Shopping other | 57 |
| Restaurants | 57 |
| Corporate management | 49 |
| Grocery stores and supermarkets | 48 |
| Car repair | 36 |
| Wholesale of construction supplies | 35 |
| Household appliances and goods | 33 |
| Construction of buildings | 32 |
| Wholesale of machinery | 29 |
| Lawyers legal | 28 |
| Hardware store | 27 |
| Bars, pubs and taverns | 26 |
| Education | 25 |
| Cafes | 25 |
| Beauty salons | 24 |
| Freight/commercial transport | 23 |
| Real estate | 22 |
Bailén Facts
| Area | 3.3 km² |
| Population | 9,535 |
| Male Population | 4,848 (50.8%) |
| Female Population | 4,687 (49.2%) |
| Population change (1975 to 2020) | -23.0% |
| Population change (2000 to 2020) | -5.3% |
| Median Age | 37.2 years (Male: 36.3, Female: 38.1) |
| GDP per capita (PPP) | $28,333 (2022) |
| Local Time | |
| Timezone | Central European Summer Time |
| Lat & Lng | 38.09639, -3.77786 |
| Postal Codes | 23710 |
Map of Bailén
Interactive Map
Bailén Population
Years 1975 to 2030
| Data | 1975 | 1990 | 2000 | 2015 | 2020 | 2025* | 2030* |
|---|---|---|---|---|---|---|---|
| Population | 12,391 | 11,397 | 10,070 | 9,365 | 9,535 | 9,178 | 8,817 |
| Population Density | 3,740.7 / km² | 3,440.6 / km² | 3,040 / km² | 2,827.2 / km² | 2,878.5 / km² | 2,770.7 / km² | 2,661.7 / km² |
Bailén Population change from 2000 to 2020
Decrease of 5.3% from year 2000 to 2020
| Location | Change since 1975 | Change since 1990 | Change since 2000 |
|---|---|---|---|
| Bailén | -23% | -16.3% | -5.3% |
| Spain | — | — | — |
Bailén Median Age
Median Age: 37.2 years
| Location | Median Age | Median Age (Female) | Median Age (Male) |
|---|---|---|---|
| Bailén | 37.2 yrs | 38.1 yrs | 36.3 yrs |
| Spain | 40.8 yrs | 42 yrs | 39.7 yrs |
Bailén Population Density
Population Density: 2,879 / km²
| Location | Population | Area | Density |
|---|---|---|---|
| Bailén | 9,535 | 3.313 km² | 2,879 / km² |
| Spain | 45.3 million | 505,993.5 km² | 89.5 / km² |
Bailén Historical and Projected Population
Estimated Population from 0 to 2100
- JRC (European Commission's Joint Research Centre) work on the GHS built-up grid
- CIESIN (Center for International Earth Science Information Network)
- [Link] Klein Goldewijk, K., Beusen, A., Doelman, J., and Stehfest, E.: Anthropogenic land use estimates for the Holocene – HYDE 3.2, Earth Syst. Sci. Data, 9, 927–953, https://doi.org/10.5194/essd-9-927-2017, 2017.
Area Codes
Percentage Area Codes used by businesses in Bailén
Price Distribution
Business distribution by price for Bailén
Human Development Index (HDI)
Statistic composite index of life expectancy, education, and per capita income.
Bailén Gross Domestic Product (GDP)
GDP per capita, PPP (constant 2017 international $)
| Data | 1990 | 1995 | 2000 | 2005 | 2010 | 2015 | 2020 | 2022 |
|---|---|---|---|---|---|---|---|---|
| GDP per capita | $18,026 | $18,948 | $22,585 | $25,397 | $26,244 | $26,973 | $25,423 | $28,333 |
| Total GDP | $83.9M | $89.1M | $106.2M | $128.2M | $138.9M | $133.1M | $122.4M | $135.1M |
Bailén CO2 Emissions
Carbon Dioxide (CO2) Emissions Per Capita in Tonnes Per Year
| Location | CO2 Emissions | CO2 Emissions Per Capita | CO2 Emissions Intensity |
|---|---|---|---|
| Bailén | 64,944 tn | 6.81 tn | 19,605.7 tons/km² |
| Spain | 330,097,501 tn | 7.29 tn | 652.4 tons/km² |
| 2013 CO2 emissions (tonnes/year) | 64,944 tn |
| 2013 CO2 emissions (tonnes/year) per capita | 6.81 tn |
| 2013 CO2 emissions intensity (tonnes/km²/year) | 19,605.7 tons/km² |
Natural Hazards Risk
Relative risk out of 10
| Hazard | Risk Level |
|---|---|
| Drought | High (10) |
| Earthquake | Low (2) |
* Risk, particularly concerning flood or landslide, may not be for the entire area.
- Dilley, M., R.S. Chen, U. Deichmann, A.L. Lerner-Lam, M. Arnold, J. Agwe, P. Buys, O. Kjekstad, B. Lyon, and G. Yetman. 2005. Natural Disaster Hotspots: A Global Risk Analysis. Washington, D.C.: World Bank. https://doi.org/10.1596/0-8213-5930-4.
- Center for Hazards and Risk Research - CHRR - Columbia University, Center for International Earth Science Information Network - CIESIN - Columbia University, and International Research Institute for Climate and Society - IRI - Columbia University. 2005. Global Drought Hazard Frequency and Distribution. Palisades, NY: NASA Socioeconomic Data and Applications Center (SEDAC). https://doi.org/10.7927/H4VX0DFT.
- Center for Hazards and Risk Research - CHRR - Columbia University, Center for International Earth Science Information Network - CIESIN - Columbia University. 2005. Global Earthquake Hazard Distribution - Peak Ground Acceleration. Palisades, NY: NASA Socioeconomic Data and Applications Center (SEDAC). https://doi.org/10.7927/H4BZ63ZS.
Recent Nearby Earthquakes
Magnitude 3.0 and greater
| Date▼ | Time↕ | Magnitude↕ | Distance↕ | Depth↕ | Location↕ | Link |
|---|---|---|---|---|---|---|
| 1/9/13 | 11:27 PM | 3.5 | 67.1 km | 21,000 m | Spain | usgs.gov |
| 1/31/12 | 2:36 PM | 4.4 | 63.6 km | 5,000 m | Spain | usgs.gov |
| 1/4/07 | 11:32 PM | 3.7 | 99.6 km | 0 m | Spain | usgs.gov |
| 8/12/05 | 12:27 PM | 3 | 96.2 km | 33,500 m | Spain | usgs.gov |
| 2/14/05 | 8:04 AM | 3.5 | 76.5 km | 11,200 m | Spain | usgs.gov |
| 4/9/04 | 2:34 PM | 3.3 | 72.1 km | 18,700 m | Spain | usgs.gov |
| 1/24/03 | 8:35 PM | 4 | 83 km | 6,400 m | Spain | usgs.gov |
| 1/2/02 | 5:14 AM | 3.2 | 29.2 km | 6,600 m | Spain | usgs.gov |
| 6/24/01 | 10:50 AM | 3.4 | 41.1 km | 9,400 m | Spain | usgs.gov |
| 6/24/01 | 4:26 AM | 3.8 | 41.2 km | 10,700 m | Spain | usgs.gov |
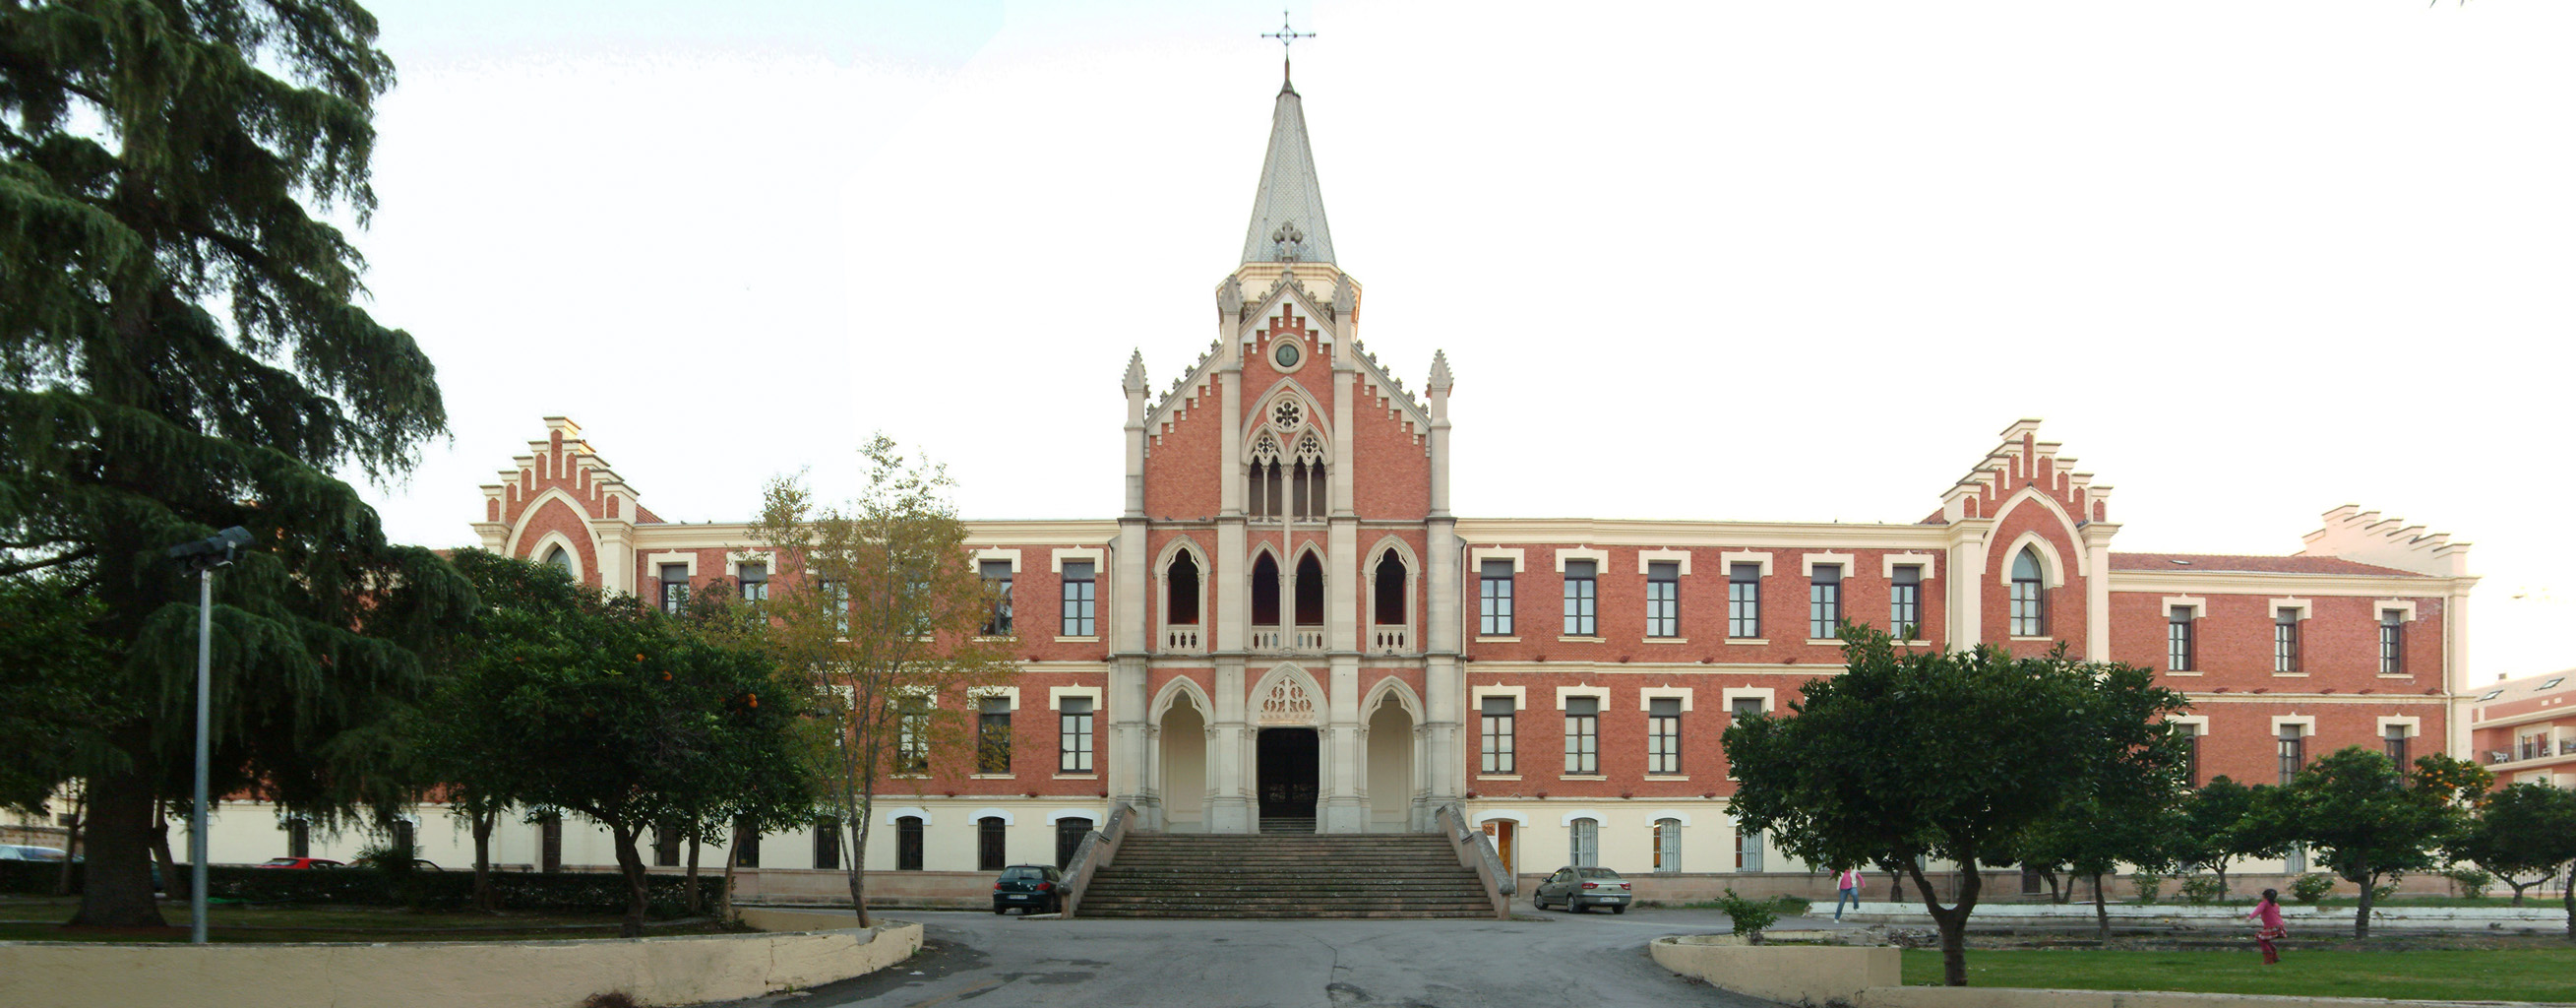
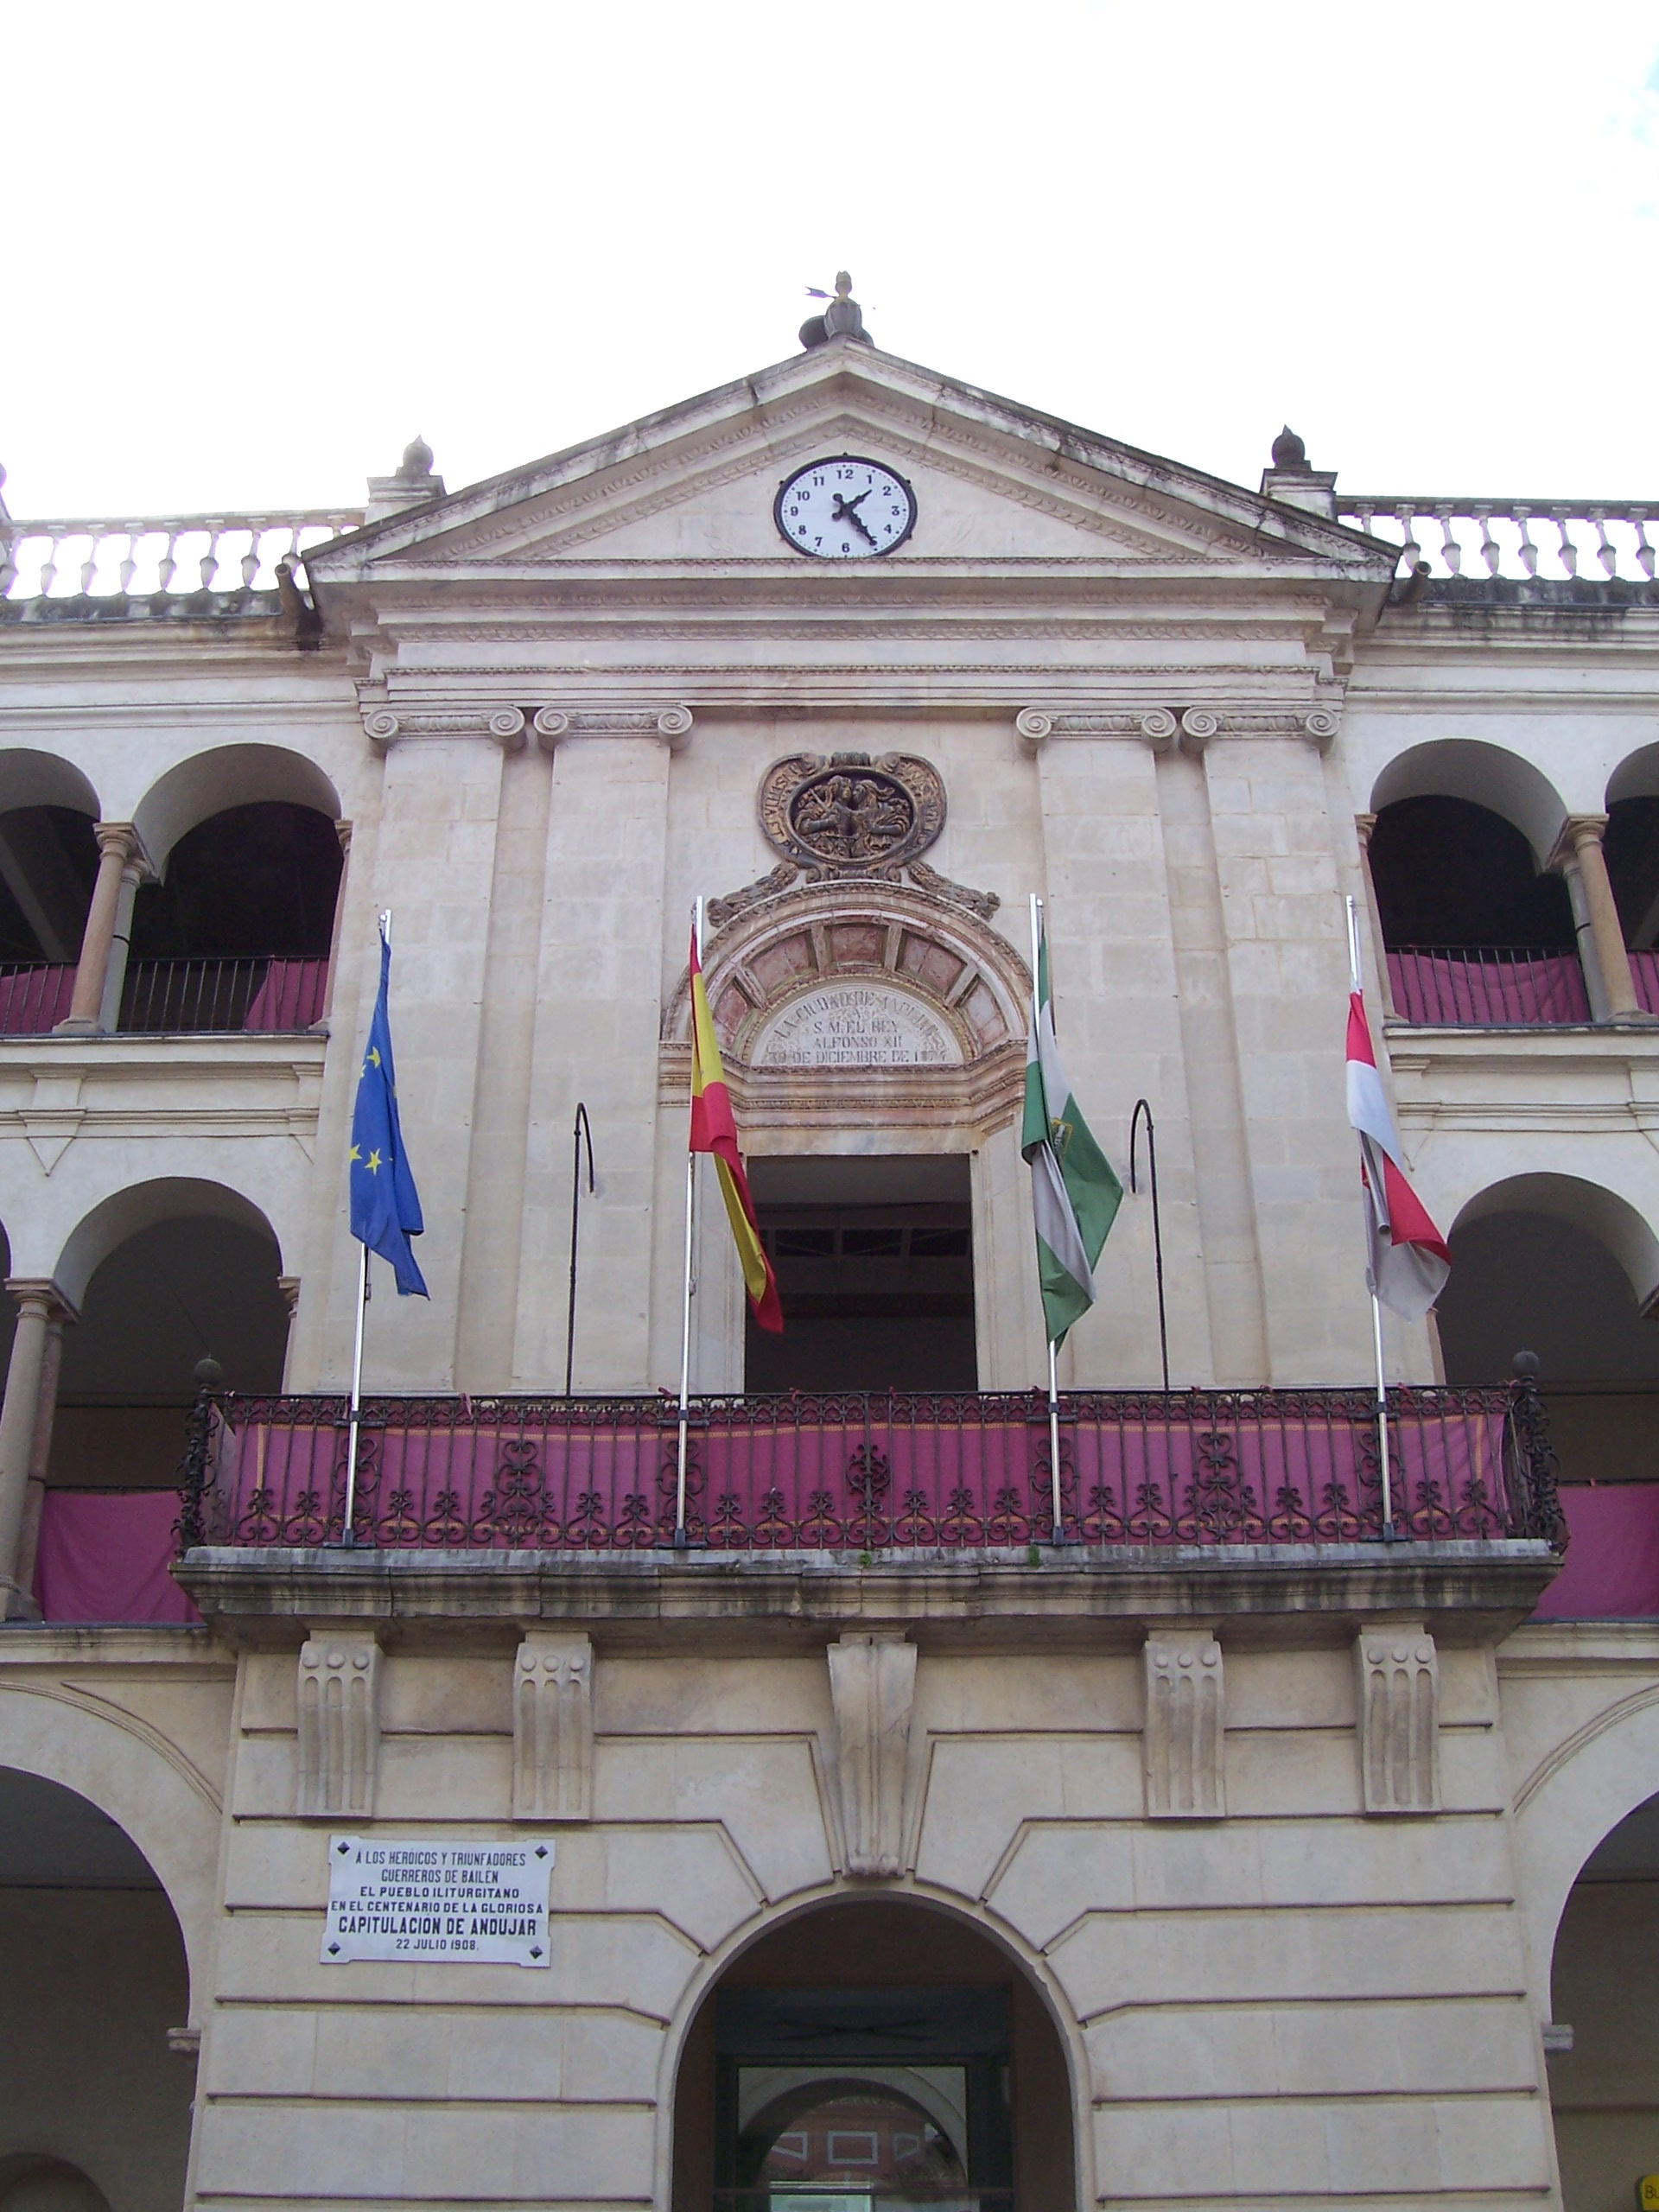
Bailén
Bailén (formerly Baylen in English) is a town in the province of Jaén, Spain.
Bailén Wikipedia Page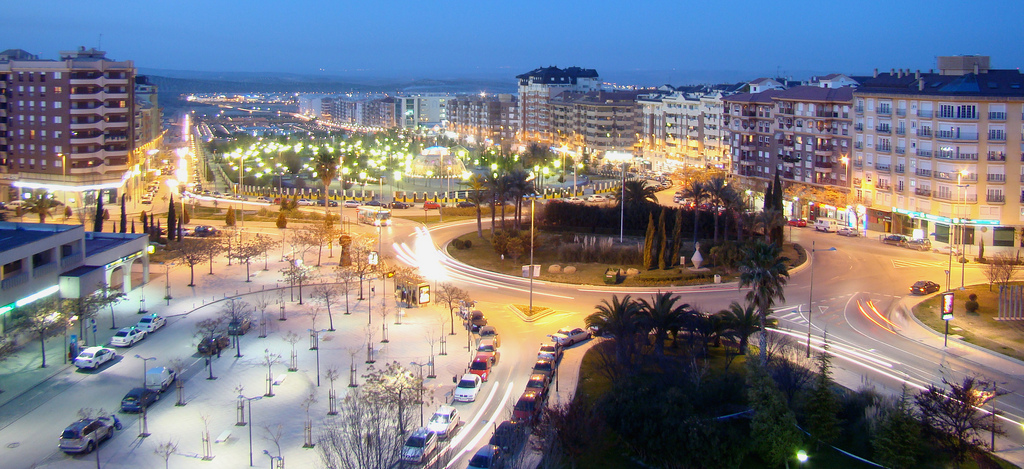
About Our Data
The data on this page is estimated using a number of publicly available tools and resources. It is provided without warranty, and could contain inaccuracies. Use at your own risk.