Industries
Business Distribution by Industry in Canfranc
| Industry Description | Number of Establishments | Average Google Rating |
|---|---|---|
| Restaurants | 15 | 4 |
| Other accommodation | 12 | 4.2 |
| Hotels and motels | 8 | 4.3 |
| Bars, pubs and taverns | 8 | 3.6 |
| Shopping | 6 | 3.8 |
Map of Canfranc
Interactive Map
Canfranc Population
Years 1975 to 2020
| Data | 1975 | 1990 | 2000 | 2015 | 2020 |
|---|---|---|---|---|---|
| Population | 138 | 110 | 74 | 67 | 66 |
| Population Density | 736 / km² | 586.7 / km² | 394.7 / km² | 357.3 / km² | 352 / km² |
Canfranc Population change from 2000 to 2015
Decrease of 9.5% from year 2000 to 2015
| Location | Change since 1975 | Change since 1990 | Change since 2000 |
|---|---|---|---|
| Canfranc | -51.4% | -39.1% | -9.5% |
| Spain | +28.4% | +17.7% | +13.2% |
Canfranc Population Density
Population Density: 352 / km²
| Location | Population | Area | Density |
|---|---|---|---|
| Canfranc | 66 | 0.188 km² | 352 / km² |
| Spain | 45.3 million | 505,993.5 km² | 89.5 / km² |
Canfranc Historical and Projected Population
Estimated Population from 0 to 2100
- JRC (European Commission's Joint Research Centre) work on the GHS built-up grid
- CIESIN (Center for International Earth Science Information Network)
- [Link] Klein Goldewijk, K., Beusen, A., Doelman, J., and Stehfest, E.: Anthropogenic land use estimates for the Holocene – HYDE 3.2, Earth Syst. Sci. Data, 9, 927–953, https://doi.org/10.5194/essd-9-927-2017, 2017.
Area Codes
Percentage Area Codes used by businesses in Canfranc
Postal Codes
Percentage of businesses by Postal Codes in Canfranc
Price Distribution
Business distribution by price for Canfranc
Human Development Index (HDI)
Statistic composite index of life expectancy, education, and per capita income.
Canfranc CO2 Emissions
Carbon Dioxide (CO2) Emissions Per Capita in Tonnes Per Year
| Location | CO2 Emissions | CO2 Emissions Per Capita | CO2 Emissions Intensity |
|---|---|---|---|
| Canfranc | 502 tn | 7.61 tn | 2,678.5 tons/km² |
| Spain | 330,097,501 tn | 7.29 tn | 652.4 tons/km² |
| 2013 CO2 emissions (tonnes/year) | 502 tn |
| 2013 CO2 emissions (tonnes/year) per capita | 7.61 tn |
| 2013 CO2 emissions intensity (tonnes/km²/year) | 2,678.5 tons/km² |
Natural Hazards Risk
Relative risk out of 10
| Hazard | Risk Level |
|---|---|
| Earthquake | Medium (4) |
* Risk, particularly concerning flood or landslide, may not be for the entire area.
- Dilley, M., R.S. Chen, U. Deichmann, A.L. Lerner-Lam, M. Arnold, J. Agwe, P. Buys, O. Kjekstad, B. Lyon, and G. Yetman. 2005. Natural Disaster Hotspots: A Global Risk Analysis. Washington, D.C.: World Bank. https://doi.org/10.1596/0-8213-5930-4.
- Center for Hazards and Risk Research - CHRR - Columbia University, Center for International Earth Science Information Network - CIESIN - Columbia University. 2005. Global Earthquake Hazard Distribution - Peak Ground Acceleration. Palisades, NY: NASA Socioeconomic Data and Applications Center (SEDAC). https://doi.org/10.7927/H4BZ63ZS.
Recent Nearby Earthquakes
Magnitude 3.0 and greater
| Date▼ | Time↕ | Magnitude↕ | Distance↕ | Depth↕ | Location↕ | Link |
|---|---|---|---|---|---|---|
| 10/12/08 | 10:34 PM | 3 | 46 km | 2,000 m | Pyrenees | usgs.gov |
| 9/18/08 | 12:55 PM | 4 | 34 km | 5,000 m | Pyrenees | usgs.gov |
| 3/18/08 | 8:05 PM | 3 | 36.4 km | 5,000 m | Pyrenees | usgs.gov |
| 10/3/07 | 9:00 PM | 3 | 43.4 km | 0 m | Pyrenees | usgs.gov |
| 6/22/07 | 6:36 PM | 3.1 | 46.1 km | 5,000 m | Pyrenees | usgs.gov |
| 1/14/07 | 2:53 AM | 3 | 41.5 km | 10,000 m | Pyrenees | usgs.gov |
| 12/15/06 | 6:34 PM | 3.1 | 43 km | 12,000 m | Pyrenees | usgs.gov |
| 10/25/06 | 7:28 AM | 3.4 | 44.9 km | 5,000 m | Pyrenees | usgs.gov |
| 7/16/06 | 10:52 AM | 3.2 | 43 km | 2,000 m | Pyrenees | usgs.gov |
| 6/10/06 | 8:52 AM | 3.2 | 37.2 km | 4,000 m | Pyrenees | usgs.gov |
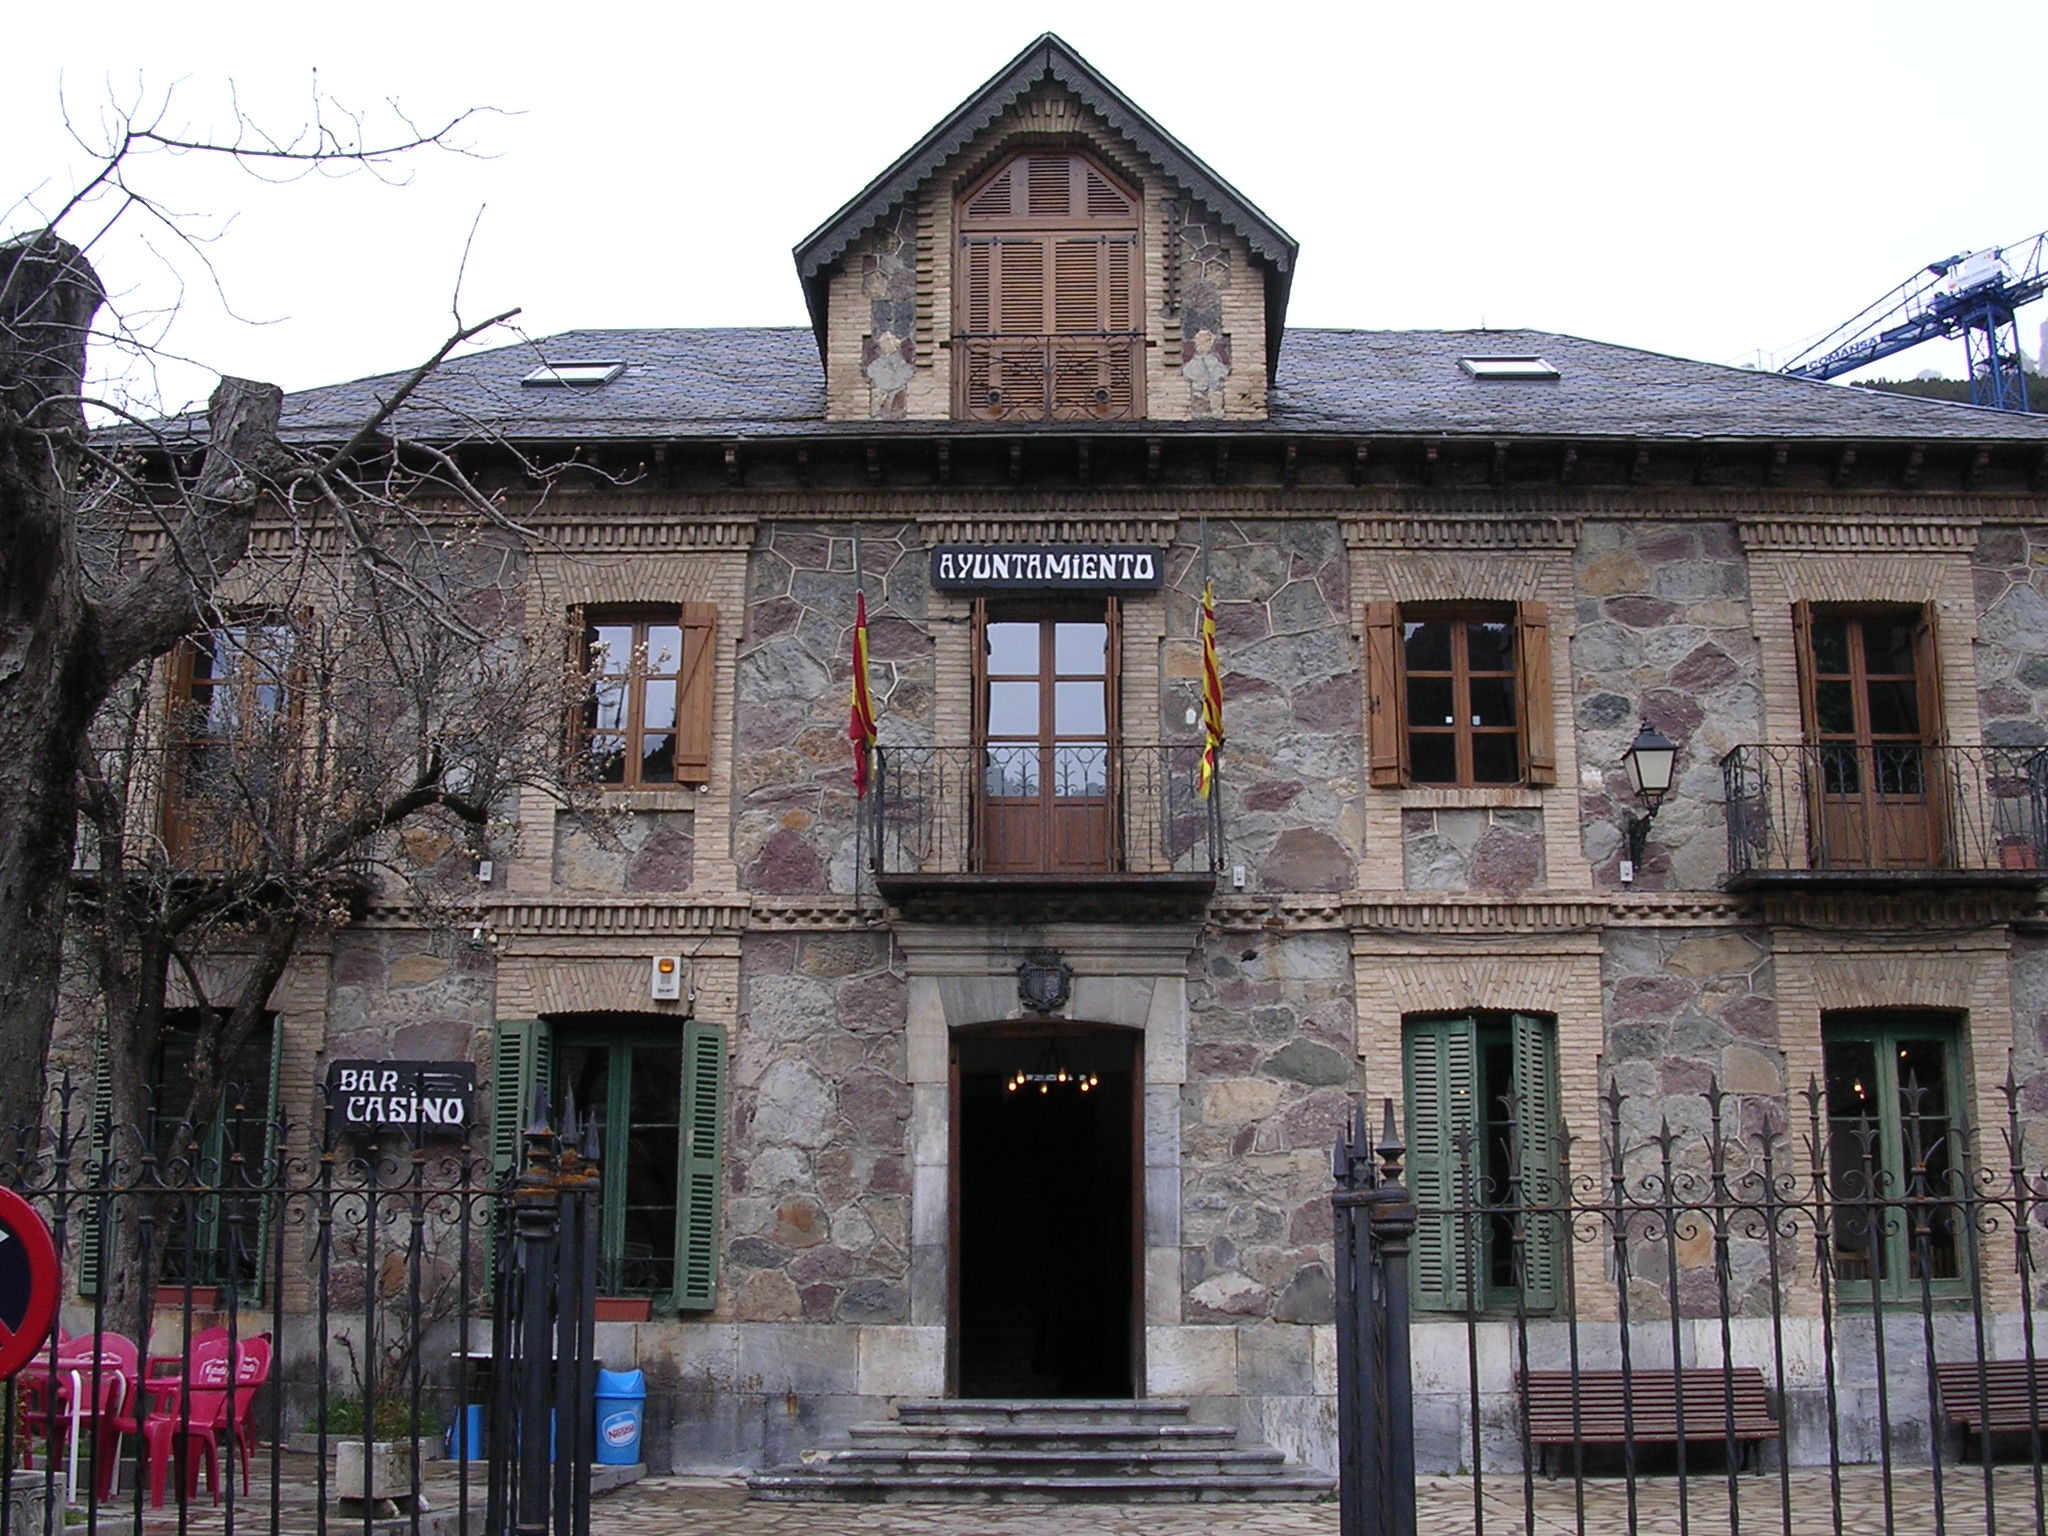
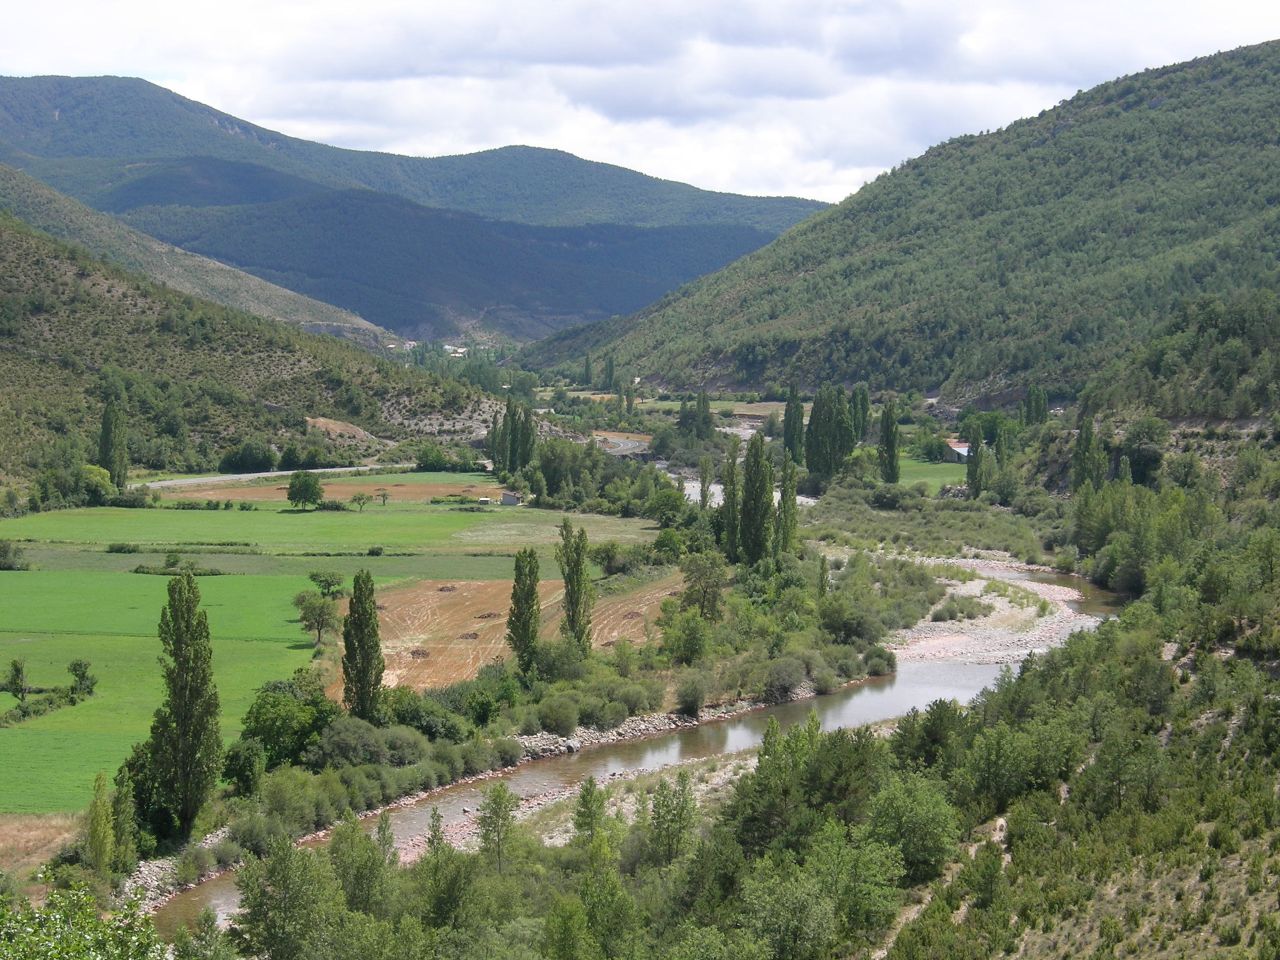
Canfranc
Canfranc (Spanish pronunciation: [kamˈfɾaŋk]) is a municipality in the Aragon Valley of north-eastern Spain consisting of two towns.
Canfranc Wikipedia Page

About Our Data
The data on this page is estimated using a number of publicly available tools and resources. It is provided without warranty, and could contain inaccuracies. Use at your own risk.