Castelnou Facts
| Area | 39.2 km² |
| Population | 123 |
| Male Population | 66 (53.6%) |
| Female Population | 57 (46.4%) |
| Population change (1975 to 2020) | -31.3% |
| Population change (2000 to 2020) | -27.6% |
| Median Age | 41.7 years (Male: 41.2, Female: 42.6) |
| GDP per capita (PPP) | $44,490 (2022) |
| Local Time | |
| Timezone | Central European Summer Time |
| Lat & Lng | 41.22892, -0.36434 |
| Postal Codes | 44592 |
Map of Castelnou
Interactive Map
Castelnou Population
Years 1975 to 2030
| Data | 1975 | 1990 | 2000 | 2015 | 2020 | 2025* | 2030* |
|---|---|---|---|---|---|---|---|
| Population | 179 | 176 | 170 | 161 | 123 | 119 | 116 |
| Population Density | 4.6 / km² | 4.5 / km² | 4.3 / km² | 4.1 / km² | 3.1 / km² | 3 / km² | 3 / km² |
Castelnou Population change from 2000 to 2020
Decrease of 27.6% from year 2000 to 2020
| Location | Change since 1975 | Change since 1990 | Change since 2000 |
|---|---|---|---|
| Castelnou | -31.3% | -30.1% | -27.6% |
| Spain | — | — | — |
Castelnou Median Age
Median Age: 41.7 years
| Location | Median Age | Median Age (Female) | Median Age (Male) |
|---|---|---|---|
| Castelnou | 41.7 yrs | 42.6 yrs | 41.2 yrs |
| Spain | 40.8 yrs | 42 yrs | 39.7 yrs |
Castelnou Population Density
Population Density: 3.1 / km²
| Location | Population | Area | Density |
|---|---|---|---|
| Castelnou | 123 | 39.2 km² | 3.1 / km² |
| Spain | 45.3 million | 505,993.5 km² | 89.5 / km² |
Castelnou Historical and Projected Population
Estimated Population from 0 to 2100
- JRC (European Commission's Joint Research Centre) work on the GHS built-up grid
- CIESIN (Center for International Earth Science Information Network)
- [Link] Klein Goldewijk, K., Beusen, A., Doelman, J., and Stehfest, E.: Anthropogenic land use estimates for the Holocene – HYDE 3.2, Earth Syst. Sci. Data, 9, 927–953, https://doi.org/10.5194/essd-9-927-2017, 2017.
Human Development Index (HDI)
Statistic composite index of life expectancy, education, and per capita income.
Castelnou Gross Domestic Product (GDP)
GDP per capita, PPP (constant 2017 international $)
| Data | 1990 | 1995 | 2000 | 2005 | 2010 | 2015 | 2020 | 2022 |
|---|---|---|---|---|---|---|---|---|
| GDP per capita | $29,264 | $30,760 | $36,665 | $40,969 | $40,591 | $39,533 | $39,920 | $44,490 |
| Total GDP | $59.4M | $64M | $78.1M | $95.1M | $100.7M | $91.6M | $88.6M | $97.2M |
Castelnou CO2 Emissions
Carbon Dioxide (CO2) Emissions Per Capita in Tonnes Per Year
| Location | CO2 Emissions | CO2 Emissions Per Capita | CO2 Emissions Intensity |
|---|---|---|---|
| Castelnou | 901 tn | 7.32 tn | 23 tons/km² |
| Spain | 330,097,501 tn | 7.29 tn | 652.4 tons/km² |
| 2013 CO2 emissions (tonnes/year) | 901 tn |
| 2013 CO2 emissions (tonnes/year) per capita | 7.32 tn |
| 2013 CO2 emissions intensity (tonnes/km²/year) | 23 tons/km² |
Recent Nearby Earthquakes
Magnitude 3.0 and greater
| Date▼ | Time↕ | Magnitude↕ | Distance↕ | Depth↕ | Location↕ | Link |
|---|---|---|---|---|---|---|
| 4/8/11 | 3:07 PM | 3.8 | 60.7 km | 11,000 m | Spain | usgs.gov |
| 12/29/08 | 12:24 PM | 3 | 93.5 km | 2,000 m | Spain | usgs.gov |
| 10/21/05 | 3:34 PM | 3.6 | 74.8 km | 10,000 m | Spain | usgs.gov |
| 7/7/03 | 6:36 PM | 3.2 | 65.2 km | 6,100 m | Spain | usgs.gov |
| 2/6/02 | 12:57 PM | 3.2 | 68.4 km | 6,800 m | Spain | usgs.gov |
| 10/25/00 | 4:19 AM | 3.3 | 79.9 km | 10,300 m | Spain | usgs.gov |
| 6/6/00 | 11:45 AM | 3 | 91.9 km | 0 m | Pyrenees | usgs.gov |
| 10/6/98 | 11:02 AM | 3.4 | 94.7 km | 10,000 m | Spain | usgs.gov |
| 9/10/98 | 3:41 PM | 3 | 51 km | 7,800 m | Spain | usgs.gov |
| 1/20/97 | 12:16 AM | 3 | 99.6 km | 10,000 m | Spain | usgs.gov |
Castelnou
Castelnou is a municipality located in the province of Teruel, Aragon, Spain. According to the 2004 census (INE), the municipality has a population of 109 inhabitants. village has acquired some international fame due to the innovative publicity camp..
Castelnou Wikipedia Page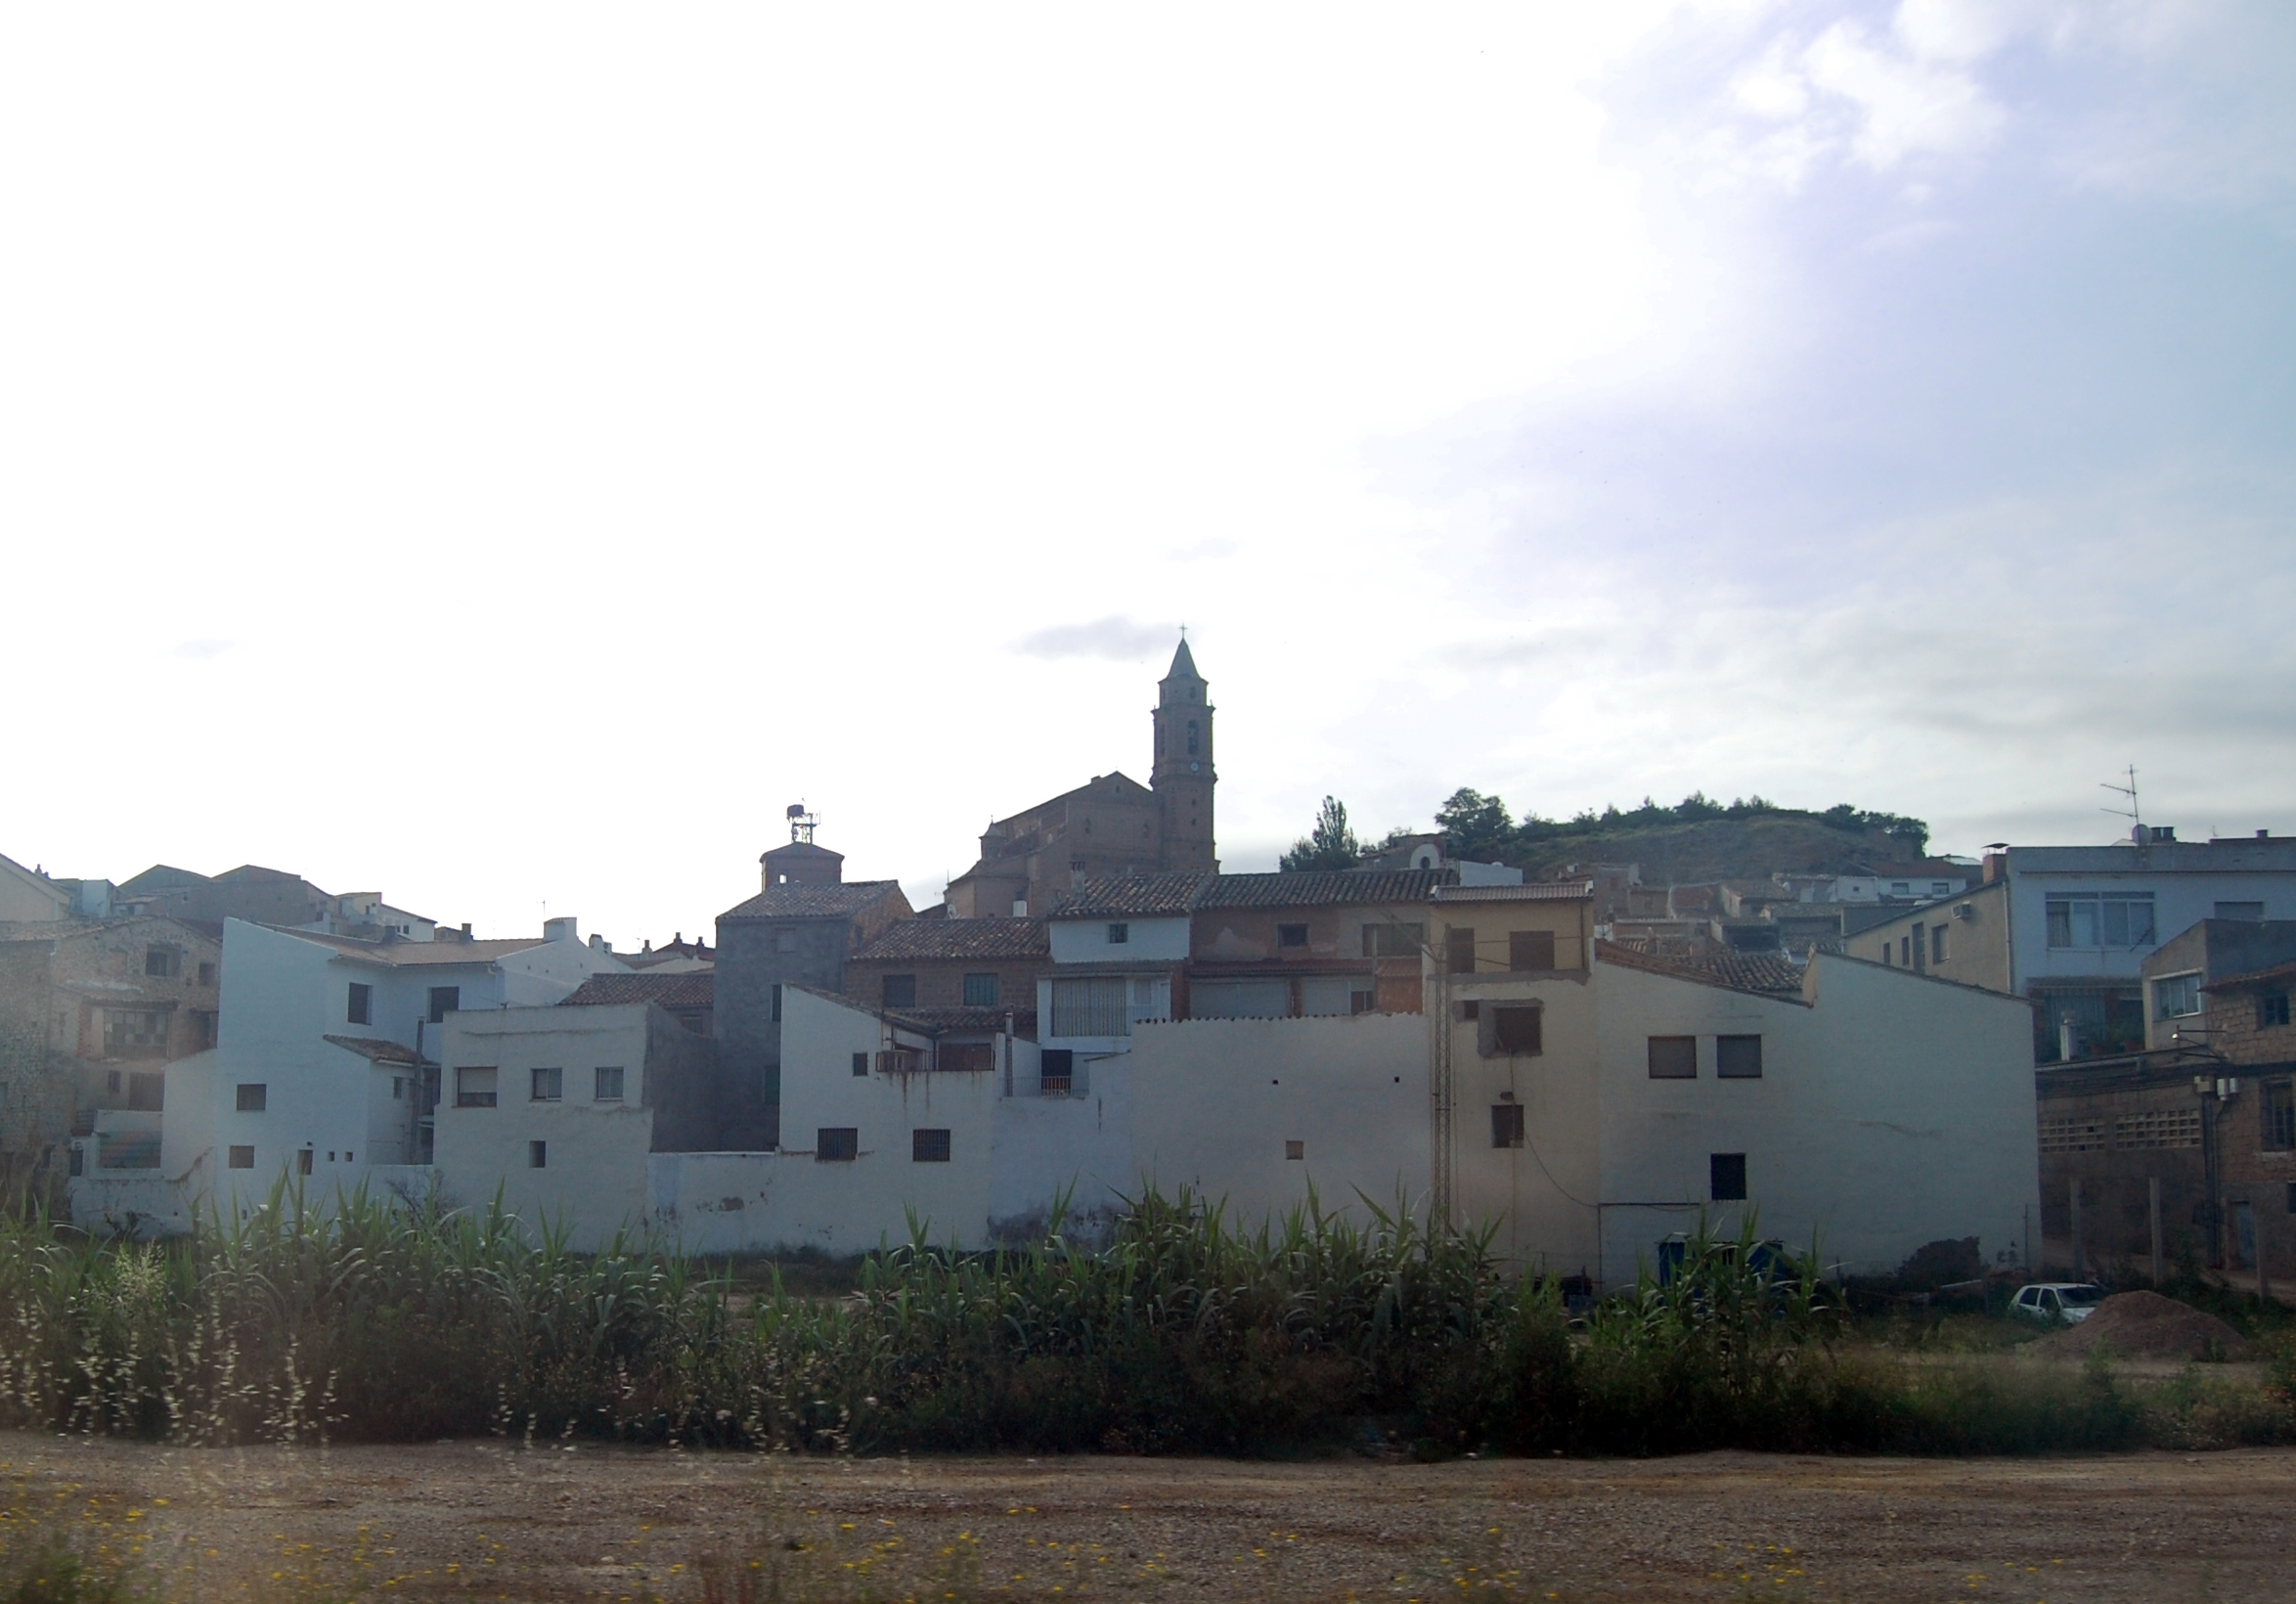

About Our Data
The data on this page is estimated using a number of publicly available tools and resources. It is provided without warranty, and could contain inaccuracies. Use at your own risk.