Categories in Graus
Industries
Business Distribution by Industry in Graus
Graus Facts
| Area | 0.6 km² |
| Population | 627 |
| Male Population | 324 (51.6%) |
| Female Population | 303 (48.4%) |
| Population change (1975 to 2020) | -34.2% |
| Population change (2000 to 2020) | -21.4% |
| Median Age | 46 years (Male: 45.1, Female: 47) |
| Local Time | |
| Timezone | Central European Summer Time |
| Lat & Lng | 42.18885, 0.33749 |
| Postal Codes | 22430, 22437, 22480, 22481 |
Map of Graus
Interactive Map
Graus Population
Years 1975 to 2020
| Data | 1975 | 1990 | 2000 | 2015 | 2020 |
|---|---|---|---|---|---|
| Population | 953 | 1,136 | 798 | 625 | 627 |
| Population Density | 1,694.2 / km² | 2,019.6 / km² | 1,418.7 / km² | 1,111.1 / km² | 1,114.7 / km² |
Graus Population change from 2000 to 2015
Decrease of 21.7% from year 2000 to 2015
| Location | Change since 1975 | Change since 1990 | Change since 2000 |
|---|---|---|---|
| Graus | -34.4% | -45% | -21.7% |
| Spain | +28.4% | +17.7% | +13.2% |
Graus Median Age
Median Age: 46 years
| Location | Median Age | Median Age (Female) | Median Age (Male) |
|---|---|---|---|
| Graus | 46 yrs | 47 yrs | 45.1 yrs |
| Spain | 40.8 yrs | 42 yrs | 39.7 yrs |
Graus Population Density
Population Density: 1,115 / km²
| Location | Population | Area | Density |
|---|---|---|---|
| Graus | 627 | 0.563 km² | 1,115 / km² |
| Spain | 45.3 million | 505,993.5 km² | 89.5 / km² |
Graus Historical and Projected Population
Estimated Population from 0 to 2100
- JRC (European Commission's Joint Research Centre) work on the GHS built-up grid
- CIESIN (Center for International Earth Science Information Network)
- [Link] Klein Goldewijk, K., Beusen, A., Doelman, J., and Stehfest, E.: Anthropogenic land use estimates for the Holocene – HYDE 3.2, Earth Syst. Sci. Data, 9, 927–953, https://doi.org/10.5194/essd-9-927-2017, 2017.
Area Codes
Percentage Area Codes used by businesses in Graus
Price Distribution
Business distribution by price for Graus
Human Development Index (HDI)
Statistic composite index of life expectancy, education, and per capita income.
Graus CO2 Emissions
Carbon Dioxide (CO2) Emissions Per Capita in Tonnes Per Year
| Location | CO2 Emissions | CO2 Emissions Per Capita | CO2 Emissions Intensity |
|---|---|---|---|
| Graus | 4,771 tn | 7.61 tn | 8,481.9 tons/km² |
| Spain | 330,097,501 tn | 7.29 tn | 652.4 tons/km² |
| 2013 CO2 emissions (tonnes/year) | 4,771 tn |
| 2013 CO2 emissions (tonnes/year) per capita | 7.61 tn |
| 2013 CO2 emissions intensity (tonnes/km²/year) | 8,481.9 tons/km² |
Recent Nearby Earthquakes
Magnitude 3.0 and greater
| Date▼ | Time↕ | Magnitude↕ | Distance↕ | Depth↕ | Location↕ | Link |
|---|---|---|---|---|---|---|
| 8/6/18 | 8:49 PM | 3.5 | 93.8 km | 10,000 m | 8km ENE of Campan, France | usgs.gov |
| 4/29/14 | 7:03 AM | 4.1 | 93.6 km | 11,100 m | 5km ENE of Pierrefitte-Nestalas, France | usgs.gov |
| 4/1/10 | 1:36 AM | 4.3 | 87.5 km | 15,000 m | Pyrenees | usgs.gov |
| 12/29/08 | 12:24 PM | 3 | 28.6 km | 2,000 m | Spain | usgs.gov |
| 6/25/08 | 3:31 PM | 3.5 | 94.6 km | 3,000 m | France | usgs.gov |
| 5/18/08 | 2:49 PM | 3.3 | 65 km | 5,000 m | Pyrenees | usgs.gov |
| 5/3/08 | 12:14 PM | 4.1 | 89.6 km | 4,000 m | Pyrenees | usgs.gov |
| 2/15/08 | 7:34 AM | 3.9 | 28.3 km | 4,000 m | Pyrenees | usgs.gov |
| 12/26/07 | 8:37 AM | 3 | 63.9 km | 5,000 m | Pyrenees | usgs.gov |
| 7/13/07 | 3:02 PM | 3.8 | 60.5 km | 5,000 m | Pyrenees | usgs.gov |
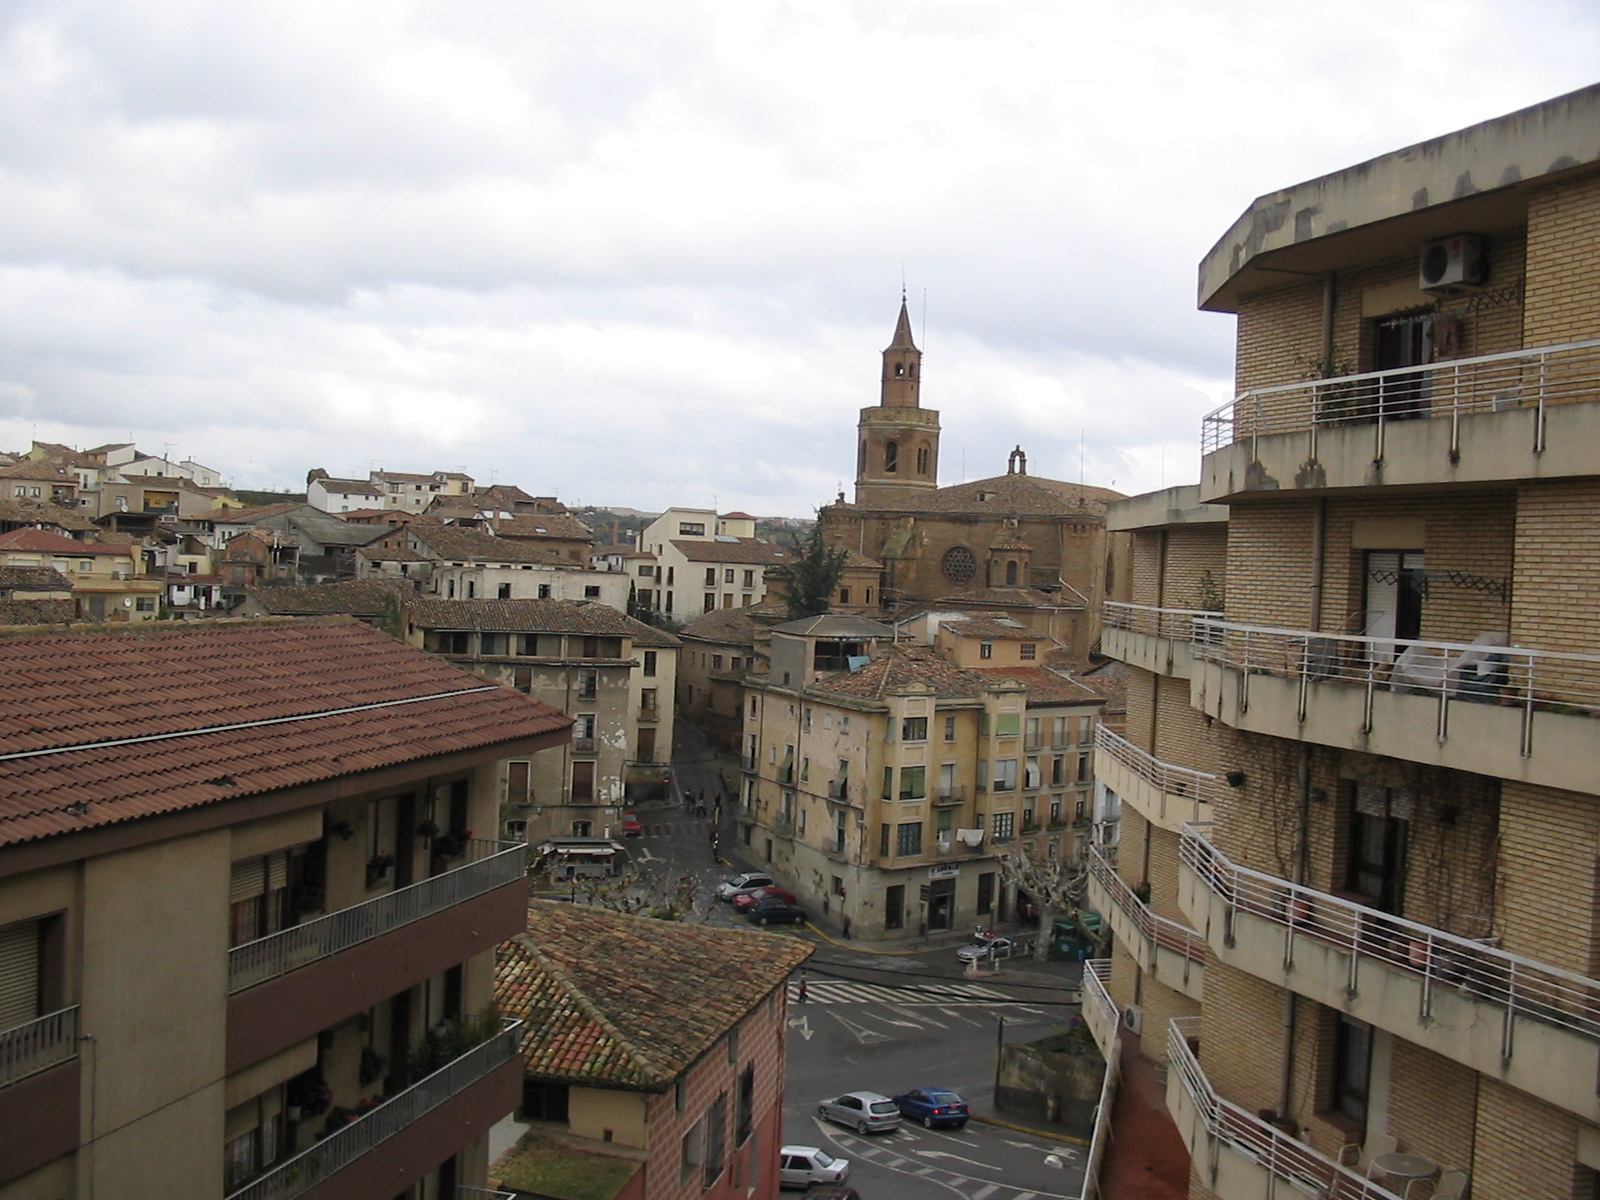
Graus
Graus (Spanish: [ˈɡɾaus], Catalan: [ˈɡɾaws]) is a village in the Spanish province of Huesca, located in the Pyrenees at the confluence of rivers Esera and Isabena. It is the administrative capital of the region. It is one of the areas of Aragon in wh..
Graus Wikipedia Page


About Our Data
The data on this page is estimated using a number of publicly available tools and resources. It is provided without warranty, and could contain inaccuracies. Use at your own risk.