Industries
Business Distribution by Industry in Los Silos
| Industry Description | Number of Establishments | Average Google Rating |
|---|---|---|
| Shopping | 16 | 4.5 |
| Restaurants | 6 | 4.3 |
| Bars, pubs and taverns | 6 | 4.3 |
Los Silos Facts
| Area | 0.5 km² |
| Population | 1,693 |
| Male Population | 854 (50.4%) |
| Female Population | 839 (49.6%) |
| Population change (1975 to 2020) | +66.3% |
| Population change (2000 to 2020) | +18.6% |
| Median Age | 45 years (Male: 43.8, Female: 46.3) |
| Local Time | |
| Timezone | Western European Summer Time |
| Lat & Lng | 28.36610, -16.81552 |
| Postal Codes | 38470, 38479 |
Map of Los Silos
Interactive Map
Los Silos Population
Years 1975 to 2020
| Data | 1975 | 1990 | 2000 | 2015 | 2020 |
|---|---|---|---|---|---|
| Population | 1,018 | 1,266 | 1,427 | 1,752 | 1,693 |
| Population Density | 2,036 / km² | 2,532 / km² | 2,854 / km² | 3,504 / km² | 3,386 / km² |
Los Silos Population change from 2000 to 2015
Increase of 22.8% from year 2000 to 2015
| Location | Change since 1975 | Change since 1990 | Change since 2000 |
|---|---|---|---|
| Los Silos | +72.1% | +38.4% | +22.8% |
| Spain | +28.4% | +17.7% | +13.2% |
Los Silos Median Age
Median Age: 45 years
| Location | Median Age | Median Age (Female) | Median Age (Male) |
|---|---|---|---|
| Los Silos | 45 yrs | 46.3 yrs | 43.8 yrs |
| Spain | 40.8 yrs | 42 yrs | 39.7 yrs |
Los Silos Population Density
Population Density: 3,386 / km²
| Location | Population | Area | Density |
|---|---|---|---|
| Los Silos | 1,693 | 0.5 km² | 3,386 / km² |
| Spain | 45.3 million | 505,993.5 km² | 89.5 / km² |
Los Silos Historical and Projected Population
Estimated Population from 0 to 2100
- JRC (European Commission's Joint Research Centre) work on the GHS built-up grid
- CIESIN (Center for International Earth Science Information Network)
- [Link] Klein Goldewijk, K., Beusen, A., Doelman, J., and Stehfest, E.: Anthropogenic land use estimates for the Holocene – HYDE 3.2, Earth Syst. Sci. Data, 9, 927–953, https://doi.org/10.5194/essd-9-927-2017, 2017.
Area Codes
Percentage Area Codes used by businesses in Los Silos
Postal Codes
Percentage of businesses by Postal Codes in Los Silos
Price Distribution
Business distribution by price for Los Silos
Human Development Index (HDI)
Statistic composite index of life expectancy, education, and per capita income.
Los Silos CO2 Emissions
Carbon Dioxide (CO2) Emissions Per Capita in Tonnes Per Year
| Location | CO2 Emissions | CO2 Emissions Per Capita | CO2 Emissions Intensity |
|---|---|---|---|
| Los Silos | 11,545 tn | 6.82 tn | 23,089.8 tons/km² |
| Spain | 330,097,501 tn | 7.29 tn | 652.4 tons/km² |
| 2013 CO2 emissions (tonnes/year) | 11,545 tn |
| 2013 CO2 emissions (tonnes/year) per capita | 6.82 tn |
| 2013 CO2 emissions intensity (tonnes/km²/year) | 23,089.8 tons/km² |
Natural Hazards Risk
Relative risk out of 10
| Hazard | Risk Level |
|---|---|
| Volcano | Medium (5) |
* Risk, particularly concerning flood or landslide, may not be for the entire area.
- Dilley, M., R.S. Chen, U. Deichmann, A.L. Lerner-Lam, M. Arnold, J. Agwe, P. Buys, O. Kjekstad, B. Lyon, and G. Yetman. 2005. Natural Disaster Hotspots: A Global Risk Analysis. Washington, D.C.: World Bank. https://doi.org/10.1596/0-8213-5930-4.
- Center for Hazards and Risk Research - CHRR - Columbia University, Center for International Earth Science Information Network - CIESIN - Columbia University. 2005. Global Volcano Hazard Frequency and Distribution. Palisades, NY: NASA Socioeconomic Data and Applications Center (SEDAC). https://doi.org/10.7927/H4BR8Q45.
Recent Nearby Earthquakes
Magnitude 3.0 and greater
| Date▼ | Time↕ | Magnitude↕ | Distance↕ | Depth↕ | Location↕ | Link |
|---|---|---|---|---|---|---|
| 1/18/19 | 6:36 AM | 4.4 | 84.8 km | 10,000 m | 33km NW of Agaete, Spain | usgs.gov |
| 5/13/08 | 7:45 AM | 3.5 | 78.9 km | 30,300 m | Canary Islands, Spain region | usgs.gov |
| 12/27/07 | 6:05 PM | 3 | 69.6 km | 0 m | Canary Islands, Spain region | usgs.gov |
| 6/3/07 | 5:48 PM | 3.1 | 70.4 km | 25,200 m | Canary Islands, Spain region | usgs.gov |
| 3/15/06 | 5:03 PM | 4.1 | 68 km | 59,900 m | Canary Islands, Spain region | usgs.gov |
| 11/22/05 | 11:32 AM | 4.1 | 26.3 km | 38,600 m | Canary Islands, Spain region | usgs.gov |
| 6/26/04 | 12:50 PM | 3.8 | 95.1 km | 58,800 m | Canary Islands, Spain region | usgs.gov |
| 5/11/04 | 8:31 PM | 3 | 8.5 km | 2,700 m | Canary Islands, Spain region | usgs.gov |
| 4/28/03 | 11:22 PM | 3.3 | 63.4 km | 23,800 m | Canary Islands, Spain region | usgs.gov |
| 3/2/03 | 12:07 AM | 3.1 | 76.2 km | 31,000 m | Canary Islands, Spain region | usgs.gov |
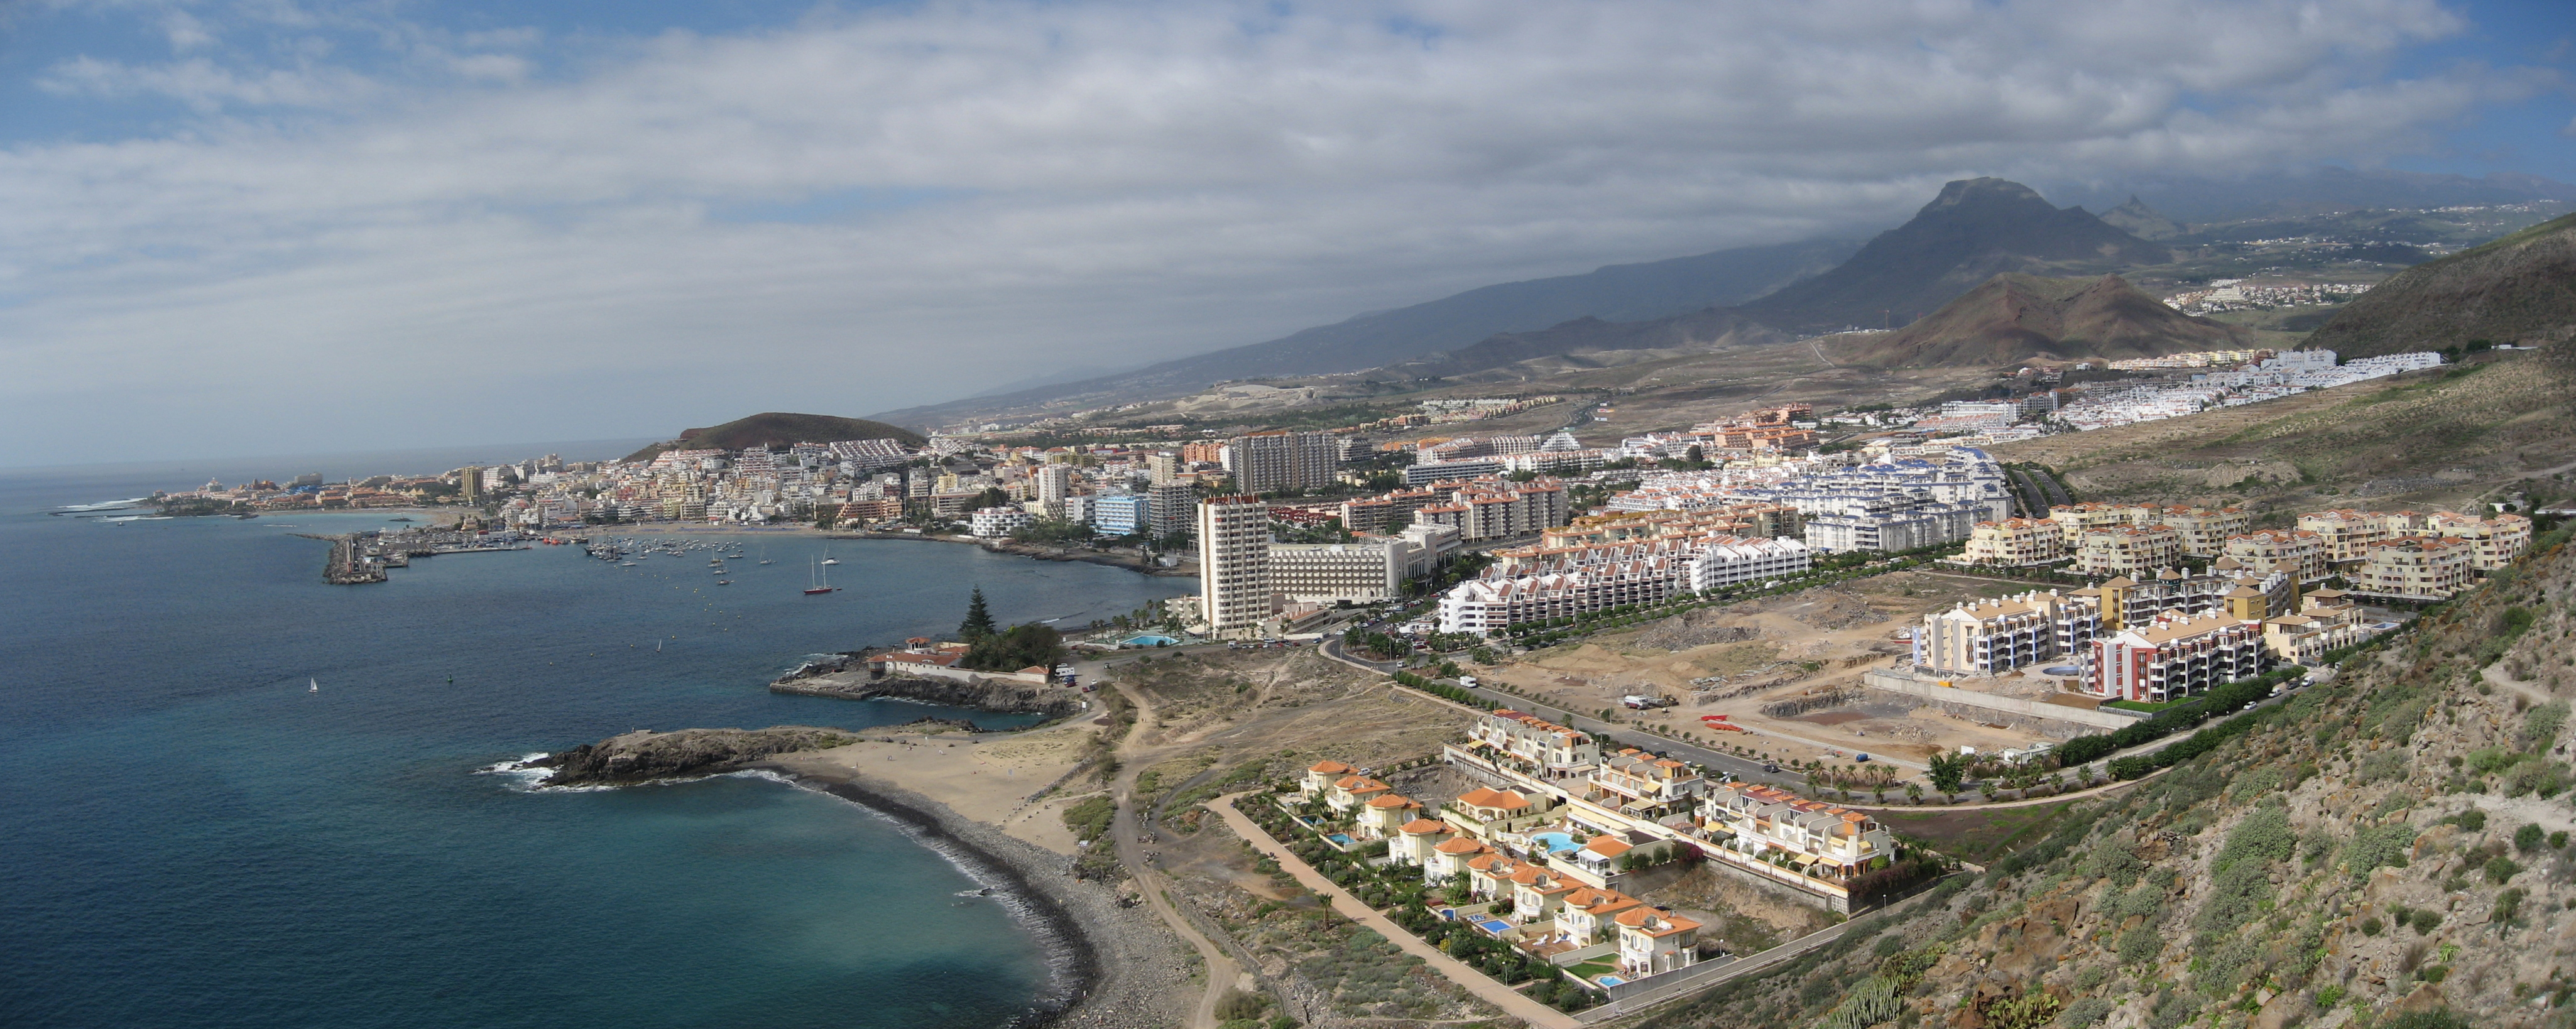
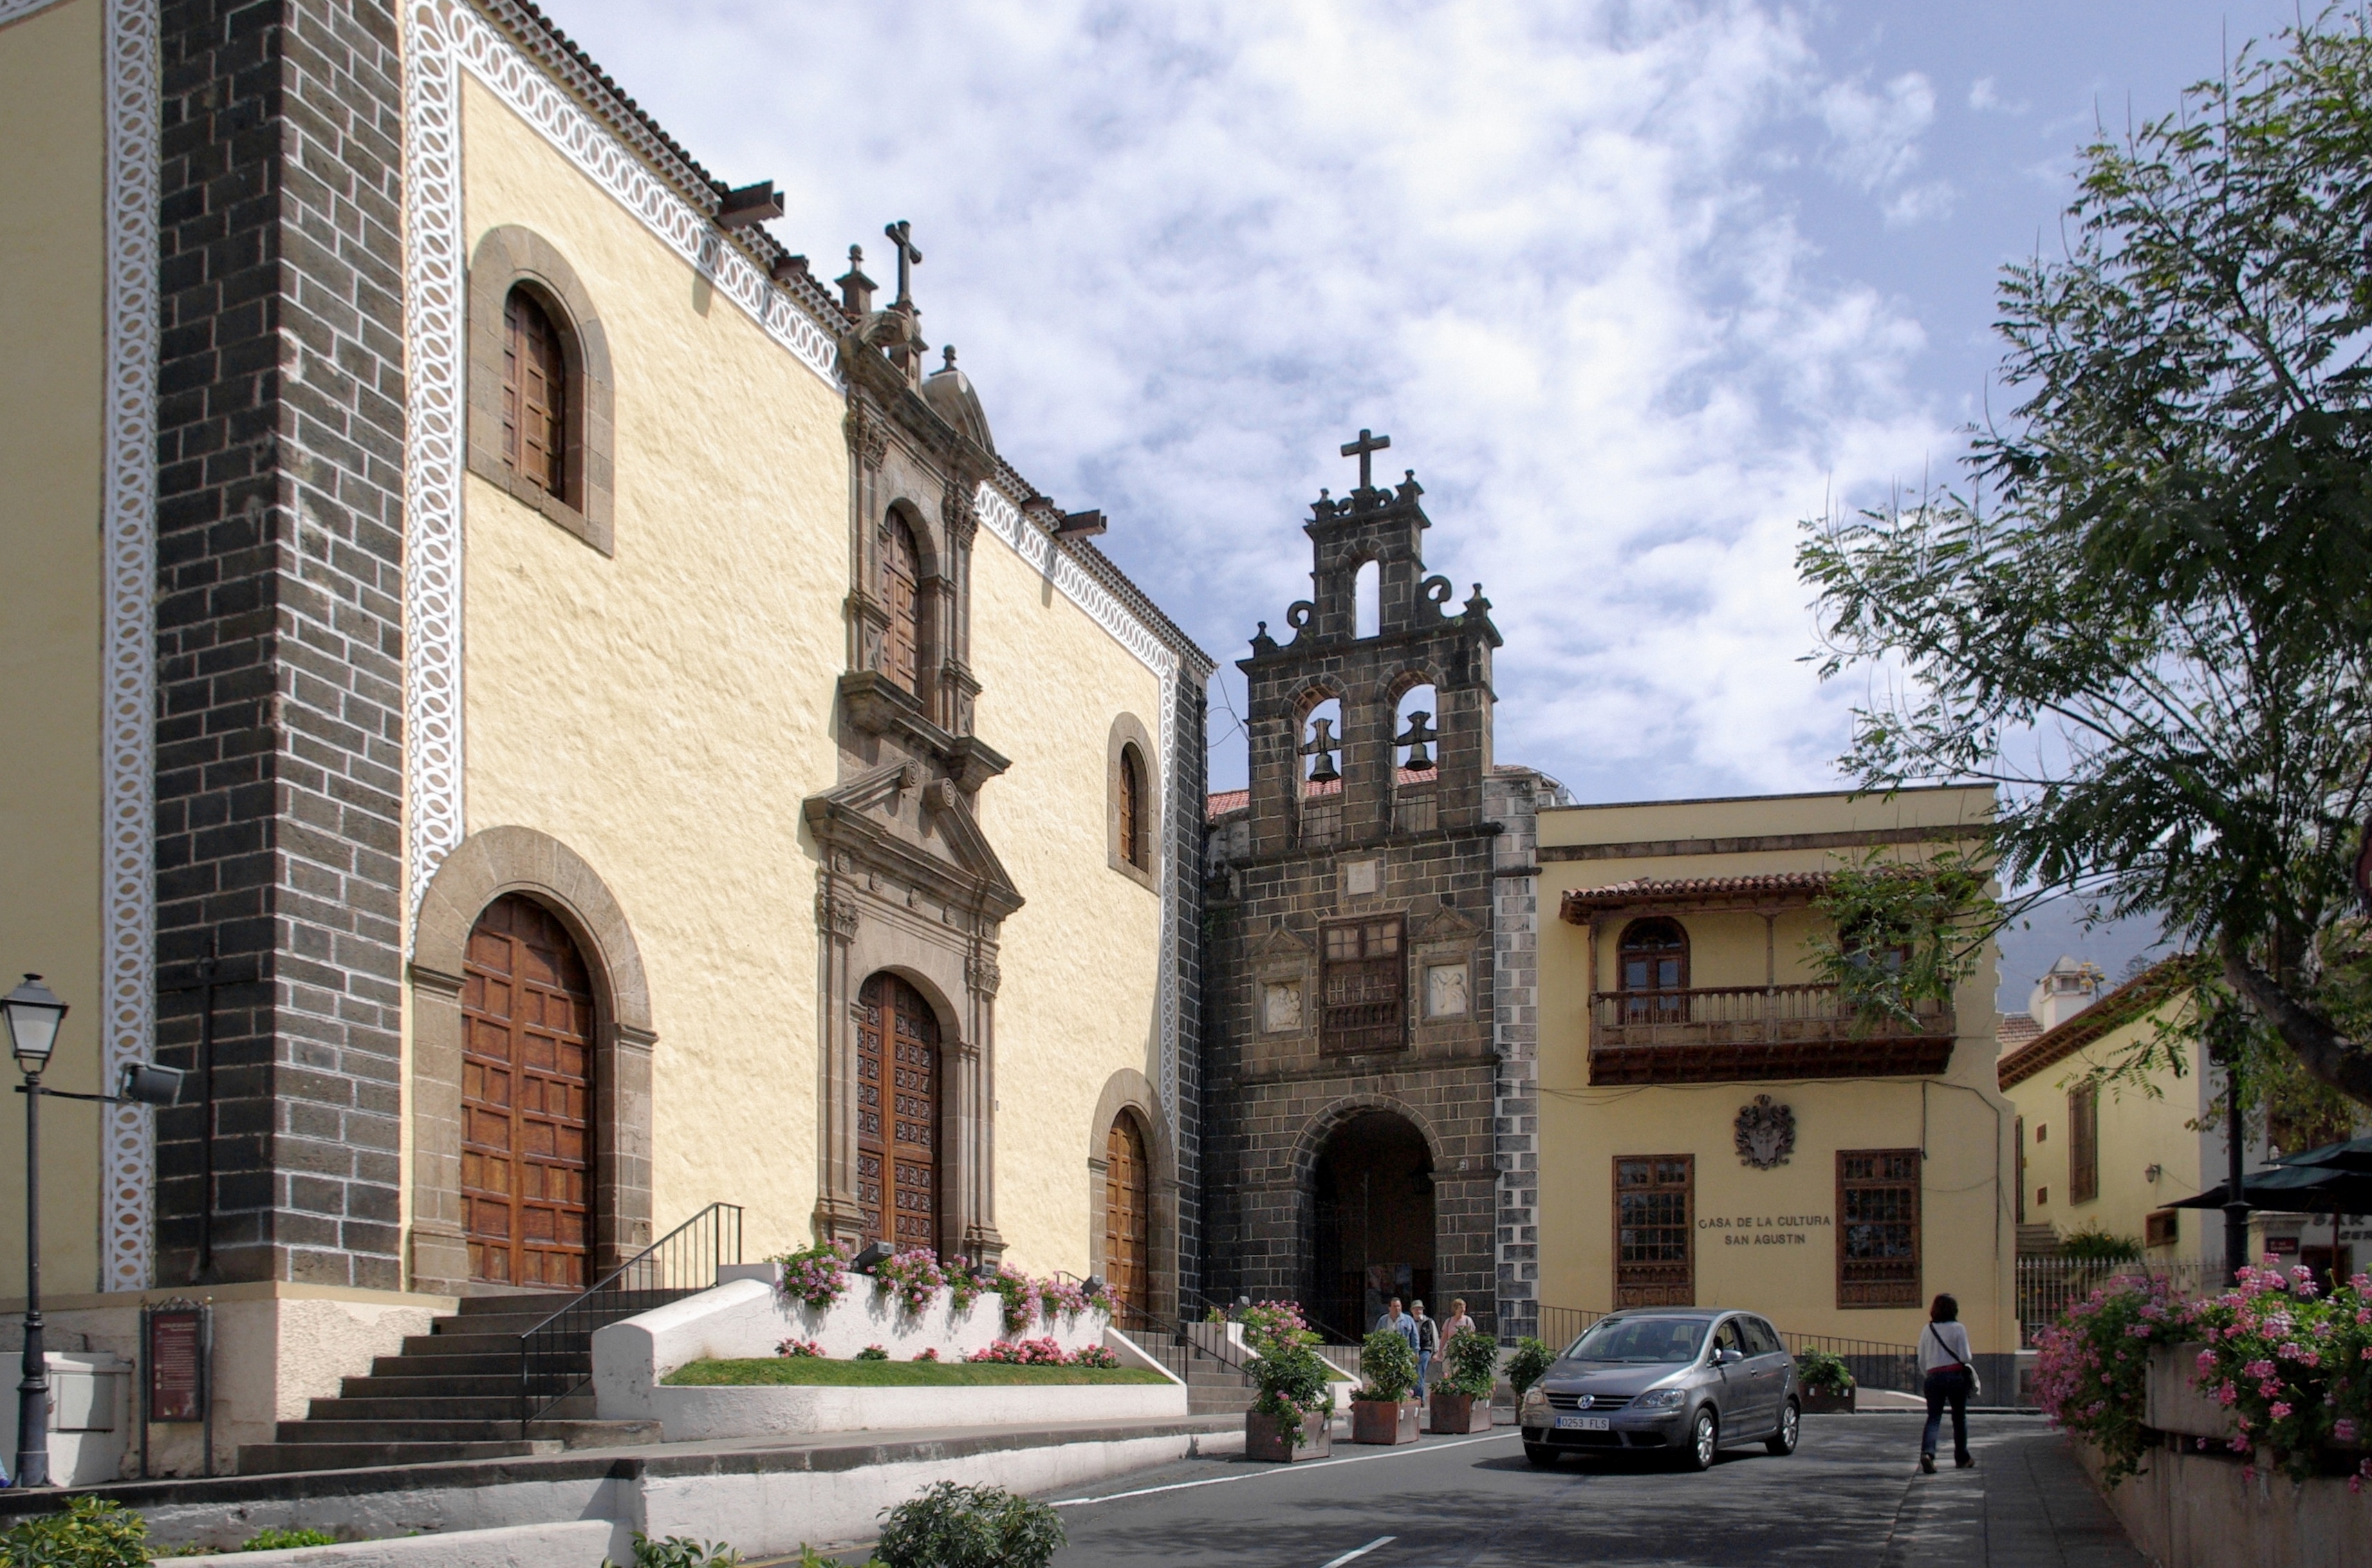
Los Silos
Los Silos is a municipality and town in the northwestern part of the island Tenerife, Canary Islands, Spain. It is located on the north coast, 57 km West of the capital Santa Cruz de Tenerife. name first appears in 1509, when the agricultural activi..
Los Silos Wikipedia Page

About Our Data
The data on this page is estimated using a number of publicly available tools and resources. It is provided without warranty, and could contain inaccuracies. Use at your own risk.