Industries
Business Distribution by Industry in Manzanera
| Industry Description | Number of Establishments | Average Google Rating |
|---|---|---|
| Shopping | 7 | 4.3 |
| Other accommodation | 7 | 4.1 |
| Hotels and motels | 6 | 4.2 |
Manzanera Facts
| Area | 177.8 km² |
| Population | 539 |
| Male Population | 286 (53.1%) |
| Female Population | 253 (46.9%) |
| Population change (1975 to 2020) | -4.1% |
| Population change (2000 to 2020) | +0.6% |
| Median Age | 42.9 years (Male: 42.9, Female: 42.7) |
| Local Time | |
| Timezone | Central European Summer Time |
| Lat & Lng | 40.05000, -0.83333 |
| Postal Codes | 44420 |
Map of Manzanera
Interactive Map
Manzanera Population
Years 1975 to 2020
| Data | 1975 | 1990 | 2000 | 2015 | 2020 |
|---|---|---|---|---|---|
| Population | 562 | 555 | 536 | 537 | 539 |
| Population Density | 3.2 / km² | 3.1 / km² | 3 / km² | 3 / km² | 3 / km² |
Manzanera Population change from 2000 to 2015
Increase of 0.2% from year 2000 to 2015
| Location | Change since 1975 | Change since 1990 | Change since 2000 |
|---|---|---|---|
| Manzanera | -4.4% | -3.2% | +0.2% |
| Spain | +28.4% | +17.7% | +13.2% |
Manzanera Median Age
Median Age: 42.9 years
| Location | Median Age | Median Age (Female) | Median Age (Male) |
|---|---|---|---|
| Manzanera | 42.9 yrs | 42.7 yrs | 42.9 yrs |
| Spain | 40.8 yrs | 42 yrs | 39.7 yrs |
Manzanera Population Density
Population Density: 3 / km²
| Location | Population | Area | Density |
|---|---|---|---|
| Manzanera | 539 | 177.8 km² | 3 / km² |
| Spain | 45.3 million | 505,993.5 km² | 89.5 / km² |
Manzanera Historical and Projected Population
Estimated Population from 0 to 2100
- JRC (European Commission's Joint Research Centre) work on the GHS built-up grid
- CIESIN (Center for International Earth Science Information Network)
- [Link] Klein Goldewijk, K., Beusen, A., Doelman, J., and Stehfest, E.: Anthropogenic land use estimates for the Holocene – HYDE 3.2, Earth Syst. Sci. Data, 9, 927–953, https://doi.org/10.5194/essd-9-927-2017, 2017.
Postal Codes
Percentage of businesses by Postal Codes in Manzanera
Price Distribution
Business distribution by price for Manzanera
Human Development Index (HDI)
Statistic composite index of life expectancy, education, and per capita income.
Manzanera CO2 Emissions
Carbon Dioxide (CO2) Emissions Per Capita in Tonnes Per Year
| Location | CO2 Emissions | CO2 Emissions Per Capita | CO2 Emissions Intensity |
|---|---|---|---|
| Manzanera | 3,944 tn | 7.32 tn | 22.2 tons/km² |
| Spain | 330,097,501 tn | 7.29 tn | 652.4 tons/km² |
| 2013 CO2 emissions (tonnes/year) | 3,944 tn |
| 2013 CO2 emissions (tonnes/year) per capita | 7.32 tn |
| 2013 CO2 emissions intensity (tonnes/km²/year) | 22.2 tons/km² |
Natural Hazards Risk
Relative risk out of 10
| Hazard | Risk Level |
|---|---|
| Drought | Low (2.7) |
| Flood | High (8) |
| Earthquake | Low (2.7) |
* Risk, particularly concerning flood or landslide, may not be for the entire area.
- Dilley, M., R.S. Chen, U. Deichmann, A.L. Lerner-Lam, M. Arnold, J. Agwe, P. Buys, O. Kjekstad, B. Lyon, and G. Yetman. 2005. Natural Disaster Hotspots: A Global Risk Analysis. Washington, D.C.: World Bank. https://doi.org/10.1596/0-8213-5930-4.
- Center for Hazards and Risk Research - CHRR - Columbia University, Center for International Earth Science Information Network - CIESIN - Columbia University, and International Research Institute for Climate and Society - IRI - Columbia University. 2005. Global Drought Hazard Frequency and Distribution. Palisades, NY: NASA Socioeconomic Data and Applications Center (SEDAC). https://doi.org/10.7927/H4VX0DFT.
- Center for Hazards and Risk Research - CHRR - Columbia University, Center for International Earth Science Information Network - CIESIN - Columbia University. 2005. Global Flood Hazard Frequency and Distribution. Palisades, NY: NASA Socioeconomic Data and Applications Center (SEDAC). https://doi.org/10.7927/H4668B3D.
- Center for Hazards and Risk Research - CHRR - Columbia University, Center for International Earth Science Information Network - CIESIN - Columbia University. 2005. Global Earthquake Hazard Distribution - Peak Ground Acceleration. Palisades, NY: NASA Socioeconomic Data and Applications Center (SEDAC). https://doi.org/10.7927/H4BZ63ZS.
Recent Nearby Earthquakes
Magnitude 3.0 and greater
| Date▼ | Time↕ | Magnitude↕ | Distance↕ | Depth↕ | Location↕ | Link |
|---|---|---|---|---|---|---|
| 1/31/08 | 12:35 AM | 3.2 | 69.9 km | 10,100 m | Spain | usgs.gov |
| 11/22/07 | 7:44 AM | 3.2 | 91.6 km | 9,000 m | Spain | usgs.gov |
| 7/9/07 | 4:32 AM | 3.3 | 20.3 km | 0 m | Spain | usgs.gov |
| 7/28/06 | 5:13 PM | 3.1 | 33.8 km | 10,800 m | Spain | usgs.gov |
| 7/23/06 | 7:50 PM | 3.6 | 30.8 km | 15,000 m | Spain | usgs.gov |
| 7/23/06 | 6:59 PM | 3.6 | 30.5 km | 15,800 m | Spain | usgs.gov |
| 3/10/06 | 7:33 PM | 4.4 | 35.8 km | 7,000 m | Spain | usgs.gov |
| 10/21/05 | 3:34 PM | 3.6 | 80.5 km | 10,000 m | Spain | usgs.gov |
| 10/7/05 | 12:20 AM | 3.2 | 57.5 km | 5,200 m | Spain | usgs.gov |
| 10/1/05 | 9:32 PM | 3.1 | 64.6 km | 7,000 m | Spain | usgs.gov |
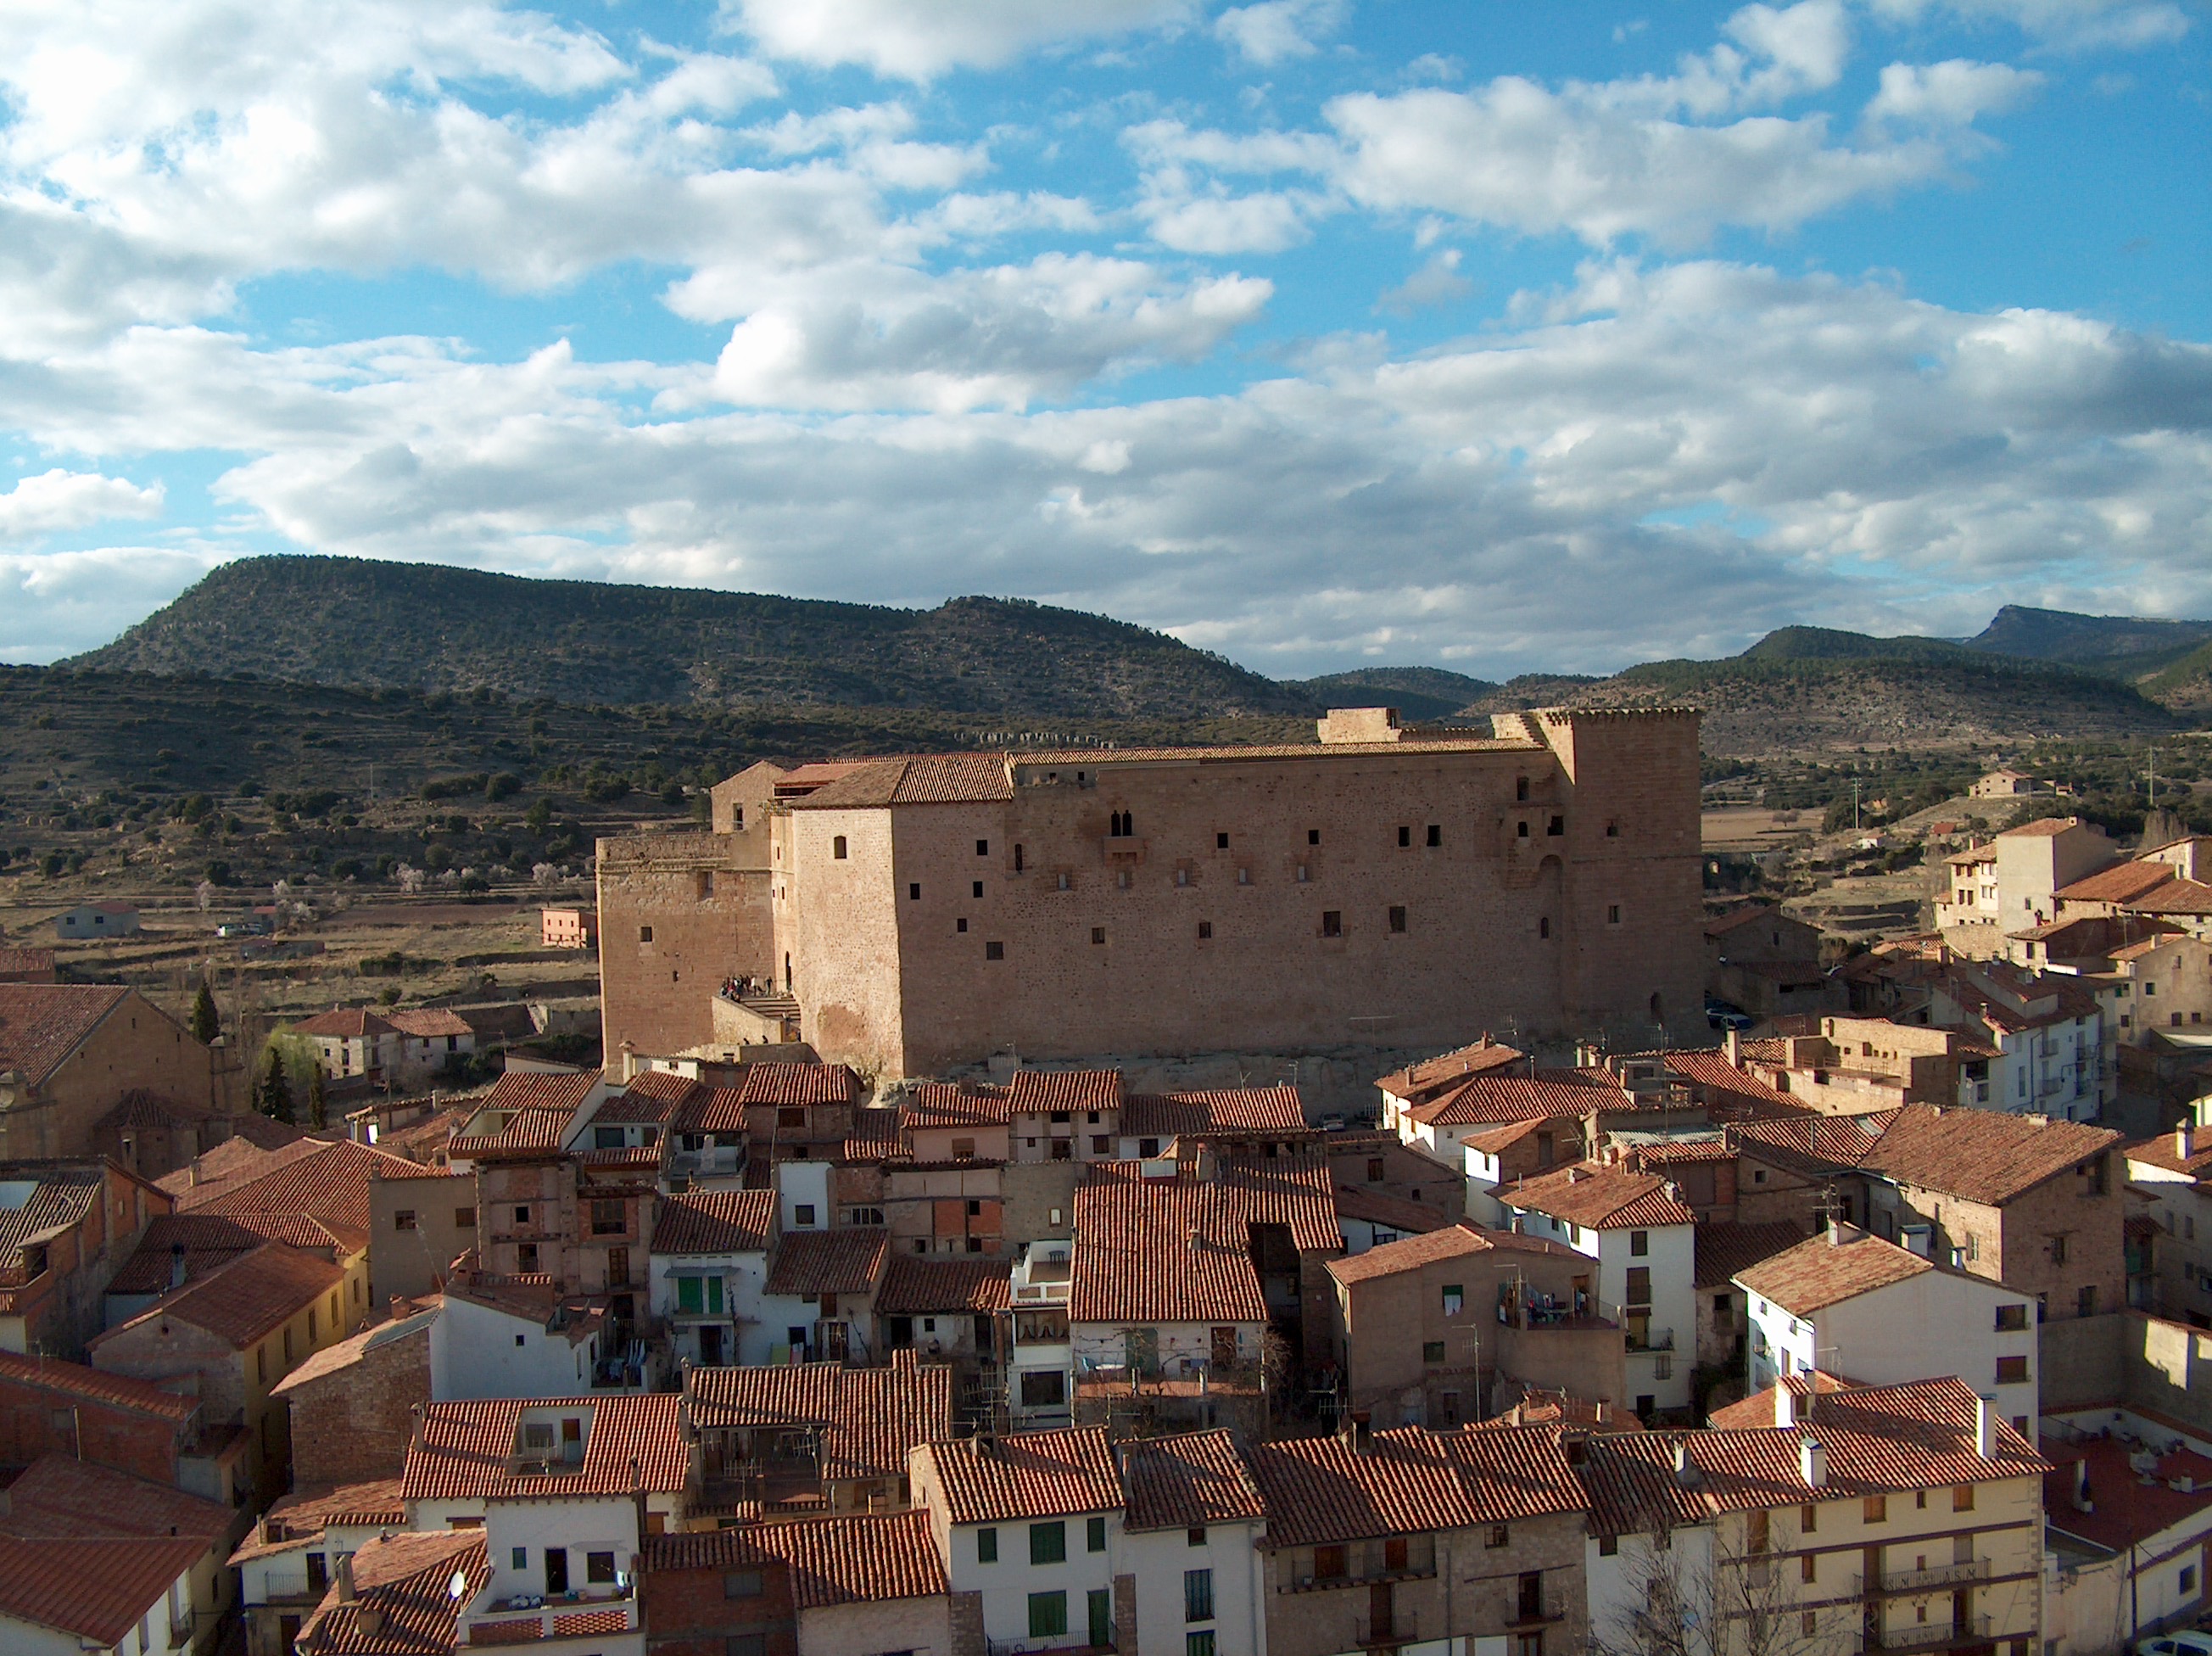
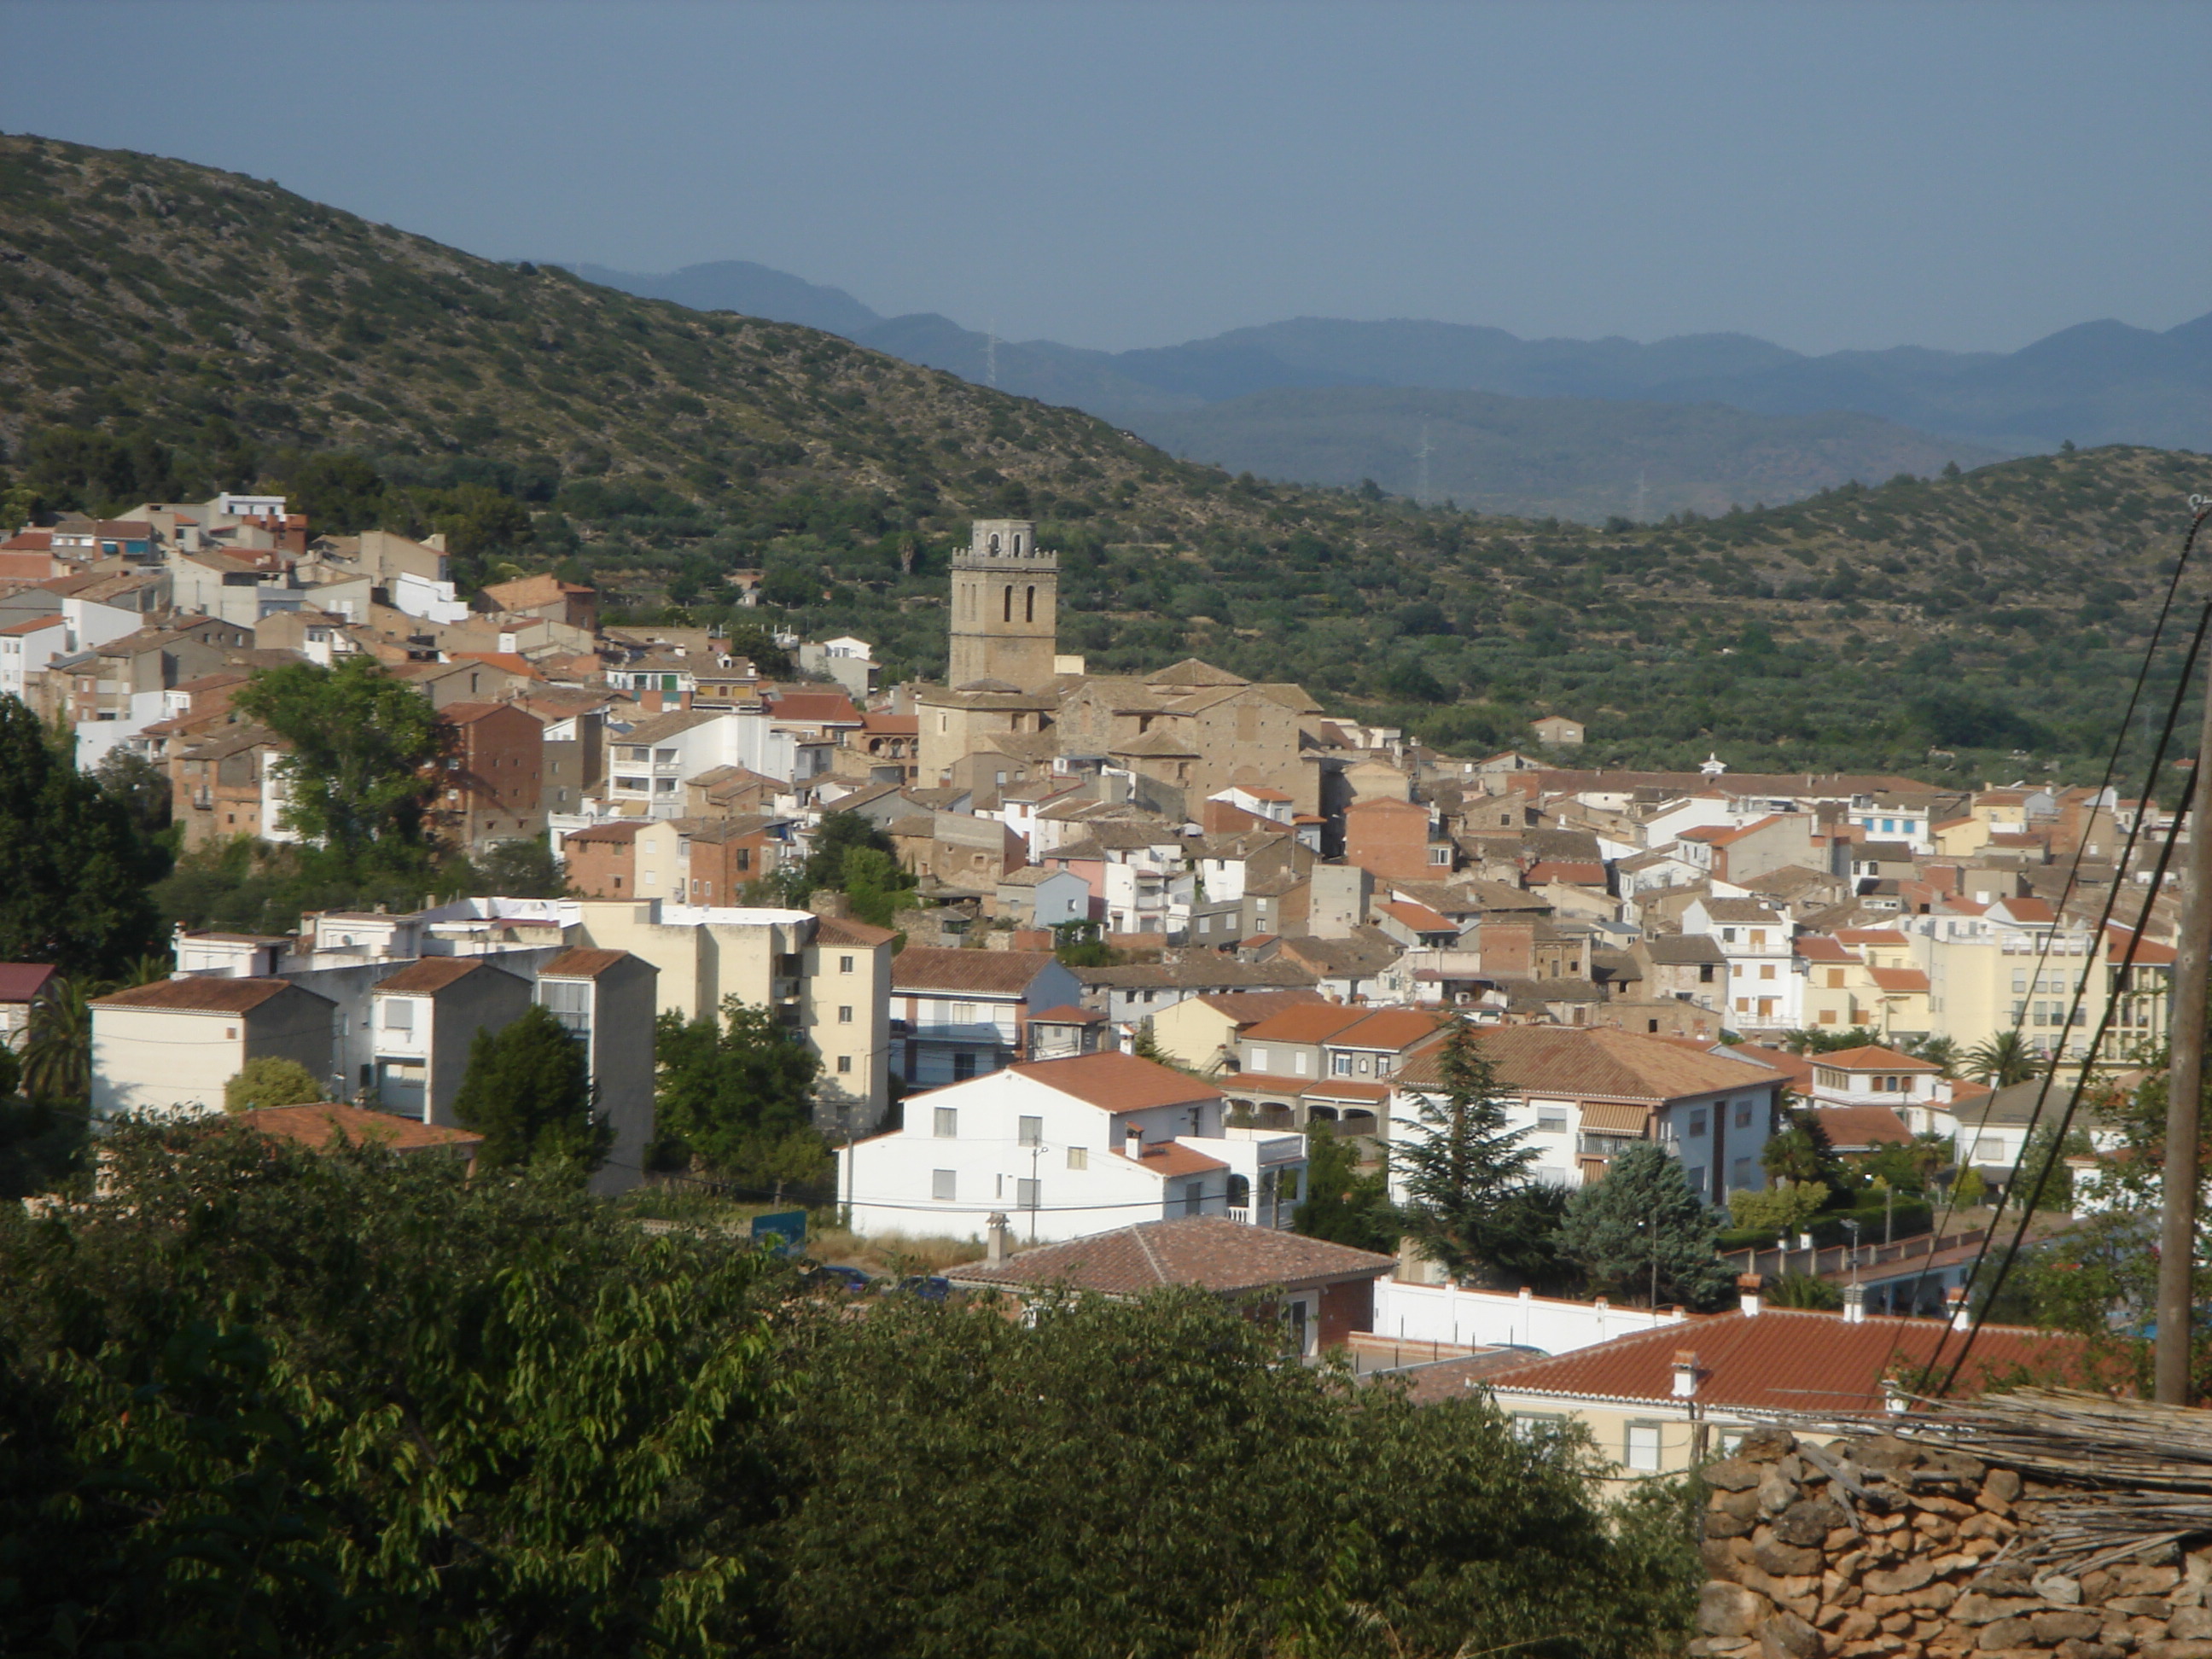
Manzanera
Manzanera is small town and municipality in the province of Teruel, part of the autonomous community of Aragón, Spain. It is in Gúdar-Javalambre comarca and it has 500 people. It is close to the ski area called Javalambre.
Manzanera Wikipedia Page

About Our Data
The data on this page is estimated using a number of publicly available tools and resources. It is provided without warranty, and could contain inaccuracies. Use at your own risk.