Industries
Business Distribution by Industry in Esse
| Industry Description | Number of Establishments |
|---|---|
| Wholesale of construction supplies | 11 |
| Shopping | 8 |
| Unreachable | 5 |
| Agricultural wholesale | 5 |
Esse Facts
| Area | 1.6 km² |
| Population | 392 |
| Population change (1975 to 2020) | -37.1% |
| Population change (2000 to 2020) | -19.3% |
| Neighborhoods | Ala-Ähtävä |
| Local Time | |
| Timezone | Eastern European Summer Time |
| Lat & Lng | 63.59371, 23.05738 |
| Postal Codes | 68820 |
Map of Esse
Interactive Map
Esse Population
Years 1975 to 2020
| Data | 1975 | 1990 | 2000 | 2015 | 2020 |
|---|---|---|---|---|---|
| Population | 623 | 552 | 486 | 385 | 392 |
| Population Density | 383.4 / km² | 339.7 / km² | 299.1 / km² | 236.9 / km² | 241.2 / km² |
Esse Population change from 2000 to 2015
Decrease of 20.8% from year 2000 to 2015
| Location | Change since 1975 | Change since 1990 | Change since 2000 |
|---|---|---|---|
| Esse | -38.2% | -30.3% | -20.8% |
| Ostrobothnia (region) | +14.6% | +7.7% | +4.2% |
| Finland | +16.3% | +10.2% | +6.2% |
Esse Population Density
Population Density: 241 / km²
| Location | Population | Area | Density |
|---|---|---|---|
| Esse | 392 | 1.625 km² | 241 / km² |
| Ostrobothnia (region) | 181,373 | 18,189.1 km² | 10 / km² |
| Finland | 5.3 million | 334,788.7 km² | 15.9 / km² |
Esse Historical and Projected Population
Estimated Population from 1000 to 2100
- JRC (European Commission's Joint Research Centre) work on the GHS built-up grid
- CIESIN (Center for International Earth Science Information Network)
- [Link] Klein Goldewijk, K., Beusen, A., Doelman, J., and Stehfest, E.: Anthropogenic land use estimates for the Holocene – HYDE 3.2, Earth Syst. Sci. Data, 9, 927–953, https://doi.org/10.5194/essd-9-927-2017, 2017.
Area Codes
Percentage Area Codes used by businesses in Esse
Human Development Index (HDI)
Statistic composite index of life expectancy, education, and per capita income.
Esse CO2 Emissions
Carbon Dioxide (CO2) Emissions Per Capita in Tonnes Per Year
| Location | CO2 Emissions | CO2 Emissions Per Capita | CO2 Emissions Intensity |
|---|---|---|---|
| Esse | 4,072 tn | 10.39 tn | 2,506.1 tons/km² |
| Ostrobothnia (region) | 828,449 tn | 4.57 tn | 45.5 tons/km² |
| Finland | 54,177,521 tn | 10.19 tn | 161.8 tons/km² |
| 2013 CO2 emissions (tonnes/year) | 4,072 tn |
| 2013 CO2 emissions (tonnes/year) per capita | 10.39 tn |
| 2013 CO2 emissions intensity (tonnes/km²/year) | 2,506.1 tons/km² |
Recent Nearby Earthquakes
Magnitude 3.0 and greater
| Date▼ | Time↕ | Magnitude↕ | Distance↕ | Depth↕ | Location↕ | Link |
|---|---|---|---|---|---|---|
| 5/22/92 | 11:06 PM | 3.8 | 96.9 km | 10,000 m | Finland | usgs.gov |
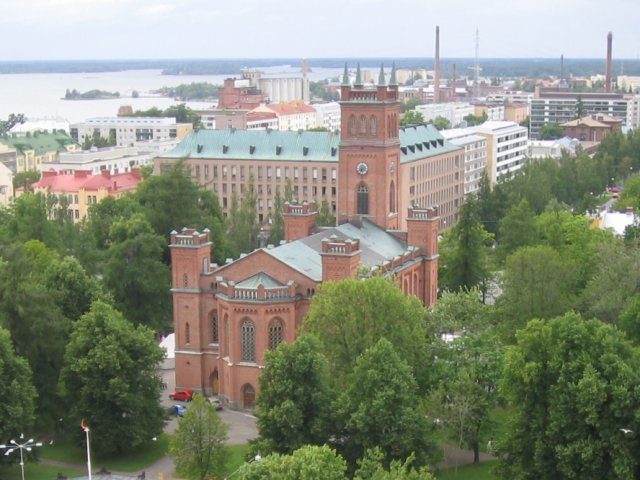
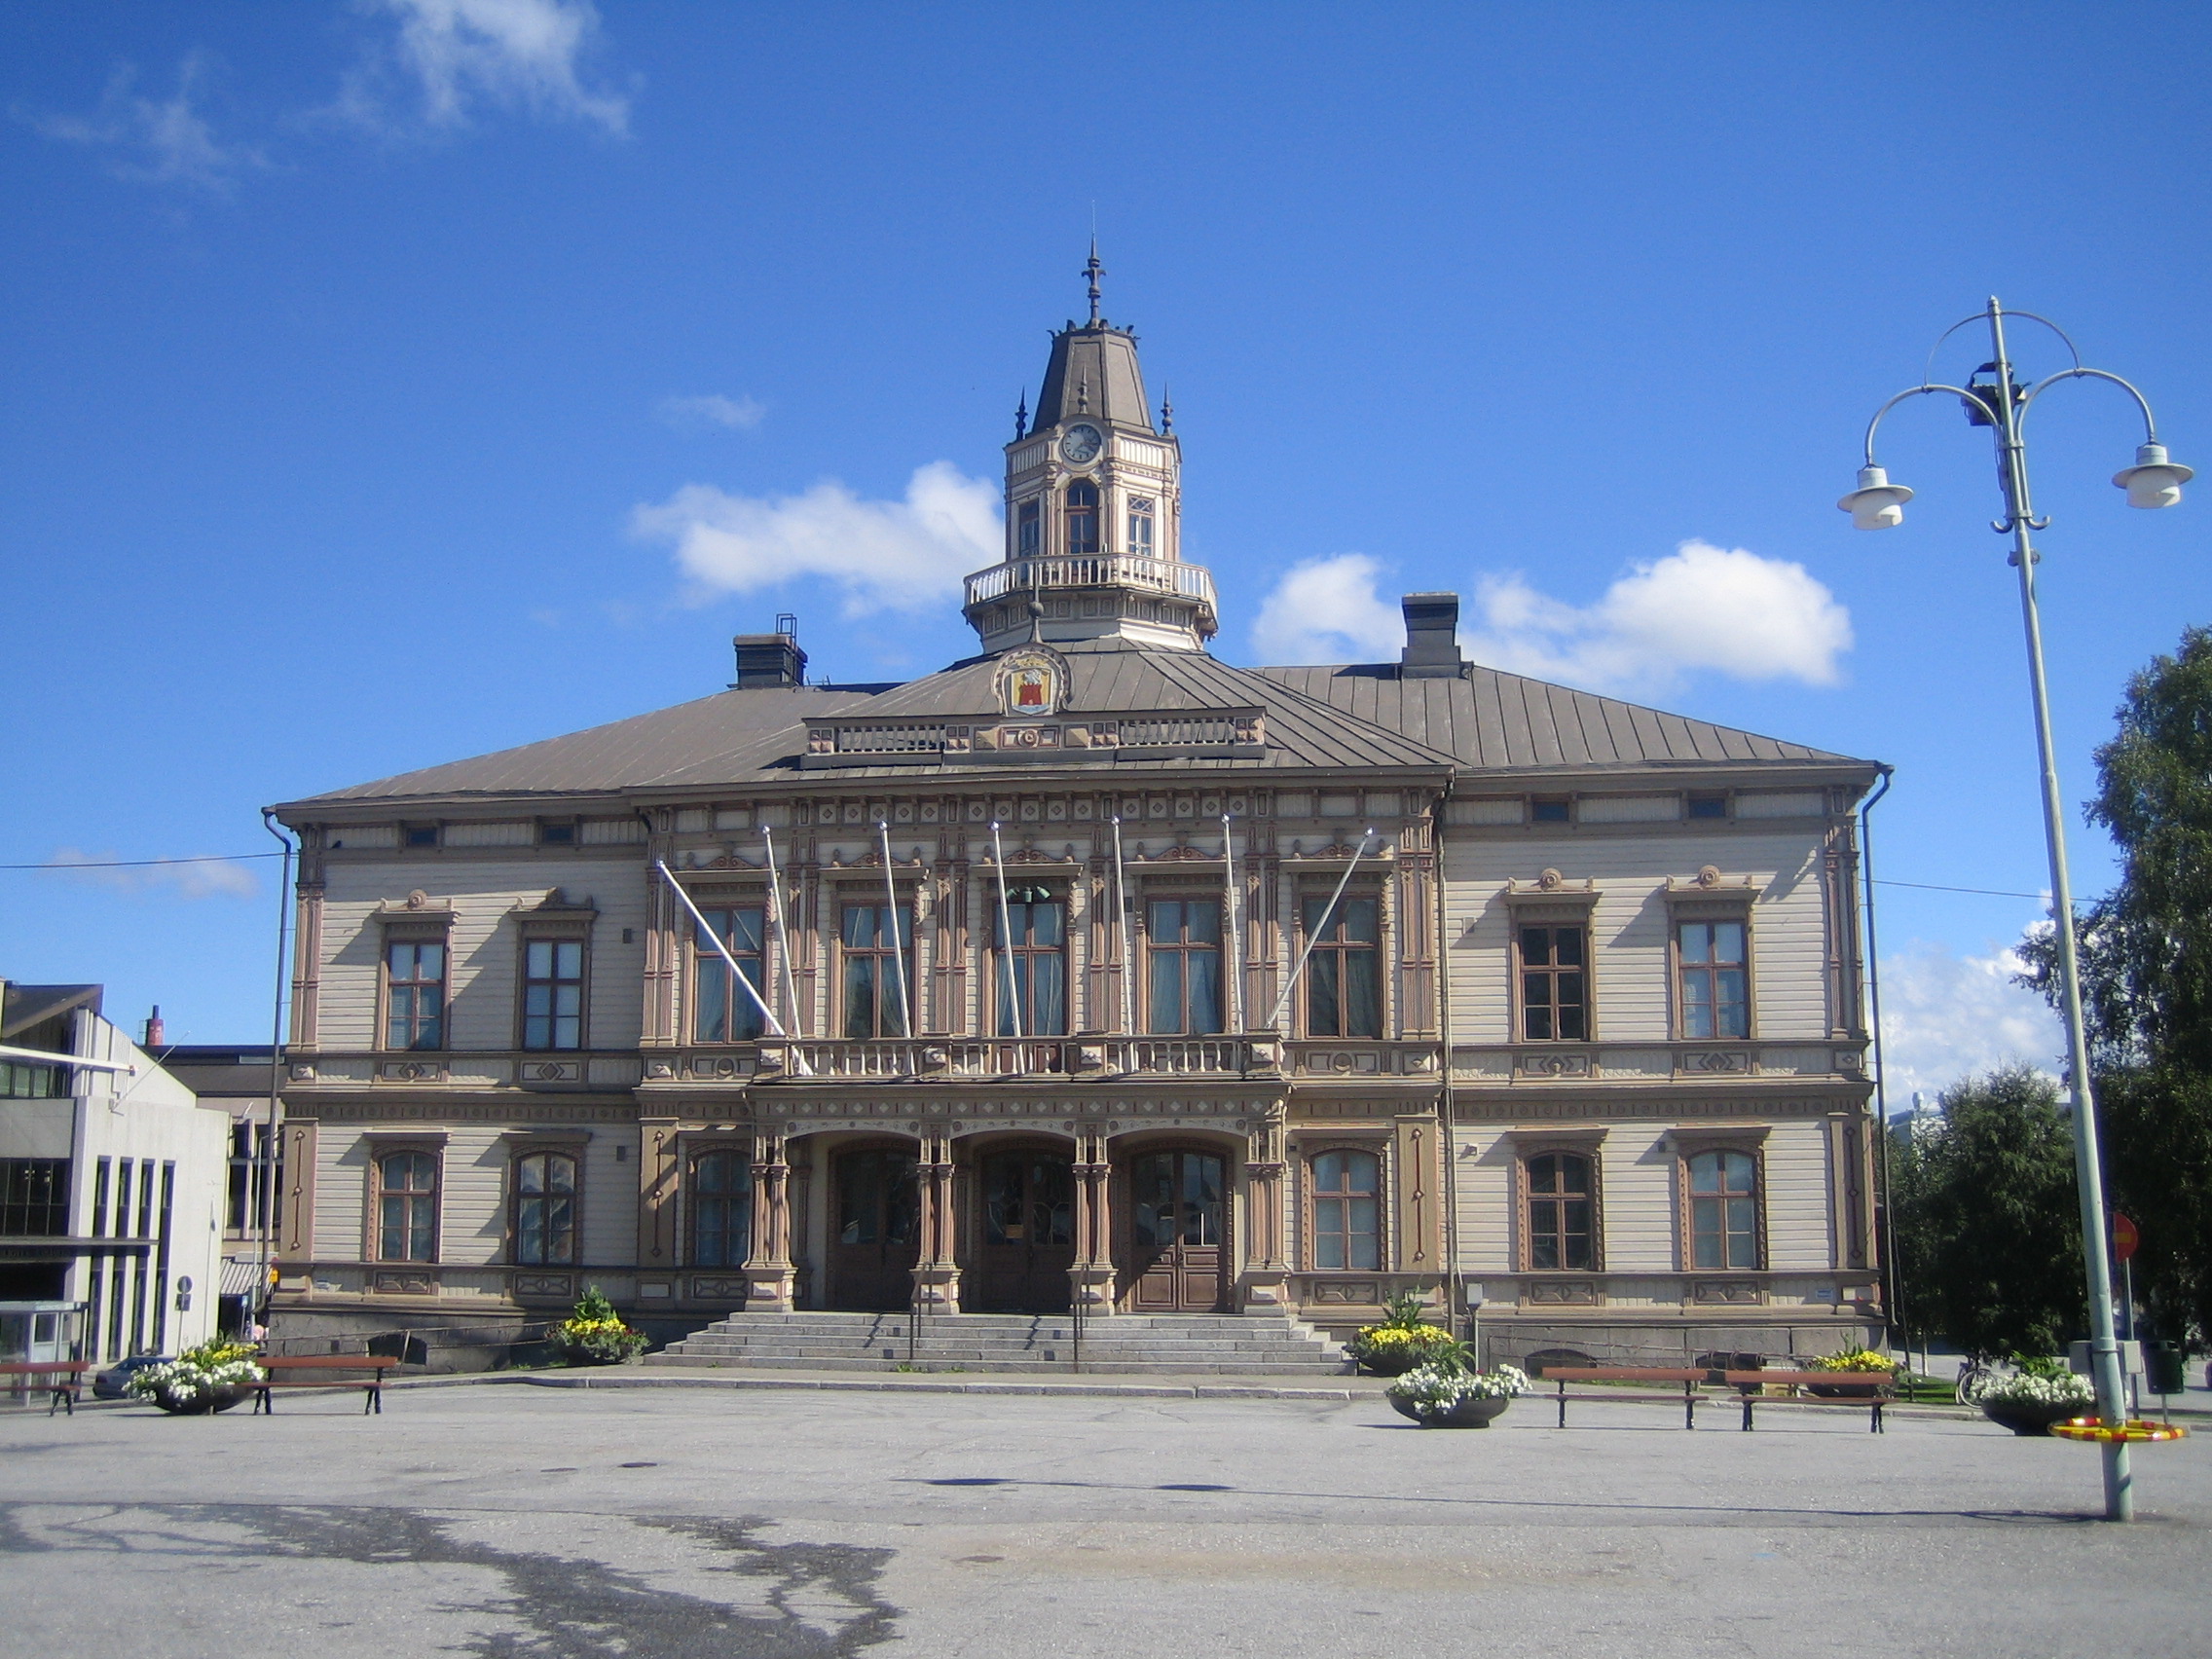
Esse
Esse (Finnish: Ähtävä) is a former municipality of Finland, now a village of Pedersöre. It has a population of about 3,000 people, of whom approximately 94% are Swedish-speaking Finns and the rest are Finnish-speaking. The village is in the northeast..
Esse Wikipedia Page

About Our Data
The data on this page is estimated using a number of publicly available tools and resources. It is provided without warranty, and could contain inaccuracies. Use at your own risk.