Categories in Ingå
Industries
Business Distribution by Industry in Ingå
| Industry Description | Number of Establishments | Average Google Rating |
|---|---|---|
| Sports and recreation | 103 | 4.1 |
| Passenger boats | 32 | — |
| Shopping | 24 | 3.9 |
| Restaurants | 19 | 3.9 |
| Construction of buildings | 14 | — |
| Wholesale of construction supplies | 12 | — |
| General contractors | 10 | 4 |
| Education | 9 | 4.1 |
| Health and medical | 8 | 4.1 |
| Travel and transportation | 7 | — |
| Construction of houses | 6 | 4.8 |
| Buses and trains | 6 | — |
Ingå Facts
| Area | 3.1 km² |
| Population | 797 |
| Male Population | 392 (49.1%) |
| Female Population | 405 (50.9%) |
| Population change (1975 to 2020) | -33.0% |
| Population change (2000 to 2020) | -19.4% |
| Median Age | 44.1 years (Male: 43.4, Female: 44.8) |
| Neighborhoods | Uusmäki |
| Local Time | |
| Timezone | Eastern European Summer Time |
| Lat & Lng | 60.04587, 24.00459 |
| Postal Codes | 10140, 10210, 10211, 10230 |
Map of Ingå
Interactive Map
Ingå Population
Years 1975 to 2020
| Data | 1975 | 1990 | 2000 | 2015 | 2020 |
|---|---|---|---|---|---|
| Population | 1,189 | 1,161 | 989 | 789 | 797 |
| Population Density | 388.2 / km² | 379.1 / km² | 322.9 / km² | 257.6 / km² | 260.2 / km² |
Ingå Population change from 2000 to 2015
Decrease of 20.2% from year 2000 to 2015
| Location | Change since 1975 | Change since 1990 | Change since 2000 |
|---|---|---|---|
| Ingå | -33.6% | -32% | -20.2% |
| Uusimaa | +59% | +32.3% | +18% |
| Finland | +16.3% | +10.2% | +6.2% |
Ingå Median Age
Median Age: 44.1 years
| Location | Median Age | Median Age (Female) | Median Age (Male) |
|---|---|---|---|
| Ingå | 44.1 yrs | 44.8 yrs | 43.4 yrs |
| Uusimaa | 39.1 yrs | 40.5 yrs | 37.6 yrs |
| Finland | 42.3 yrs | 44 yrs | 40.7 yrs |
Ingå Population Density
Population Density: 260 / km²
| Location | Population | Area | Density |
|---|---|---|---|
| Ingå | 797 | 3.063 km² | 260 / km² |
| Uusimaa | 1.6 million | 16,059.2 km² | 101 / km² |
| Finland | 5.3 million | 334,788.7 km² | 15.9 / km² |
Ingå Historical and Projected Population
Estimated Population from 900 to 2100
- JRC (European Commission's Joint Research Centre) work on the GHS built-up grid
- CIESIN (Center for International Earth Science Information Network)
- [Link] Klein Goldewijk, K., Beusen, A., Doelman, J., and Stehfest, E.: Anthropogenic land use estimates for the Holocene – HYDE 3.2, Earth Syst. Sci. Data, 9, 927–953, https://doi.org/10.5194/essd-9-927-2017, 2017.
Area Codes
Percentage Area Codes used by businesses in Ingå
Price Distribution
Business distribution by price for Ingå
Human Development Index (HDI)
Statistic composite index of life expectancy, education, and per capita income.
Ingå CO2 Emissions
Carbon Dioxide (CO2) Emissions Per Capita in Tonnes Per Year
| Location | CO2 Emissions | CO2 Emissions Per Capita | CO2 Emissions Intensity |
|---|---|---|---|
| Ingå | 6,469 tn | 8.12 tn | 2,112.2 tons/km² |
| Uusimaa | 7,647,199 tn | 4.72 tn | 476.2 tons/km² |
| Finland | 54,177,521 tn | 10.19 tn | 161.8 tons/km² |
| 2013 CO2 emissions (tonnes/year) | 6,469 tn |
| 2013 CO2 emissions (tonnes/year) per capita | 8.12 tn |
| 2013 CO2 emissions intensity (tonnes/km²/year) | 2,112.2 tons/km² |
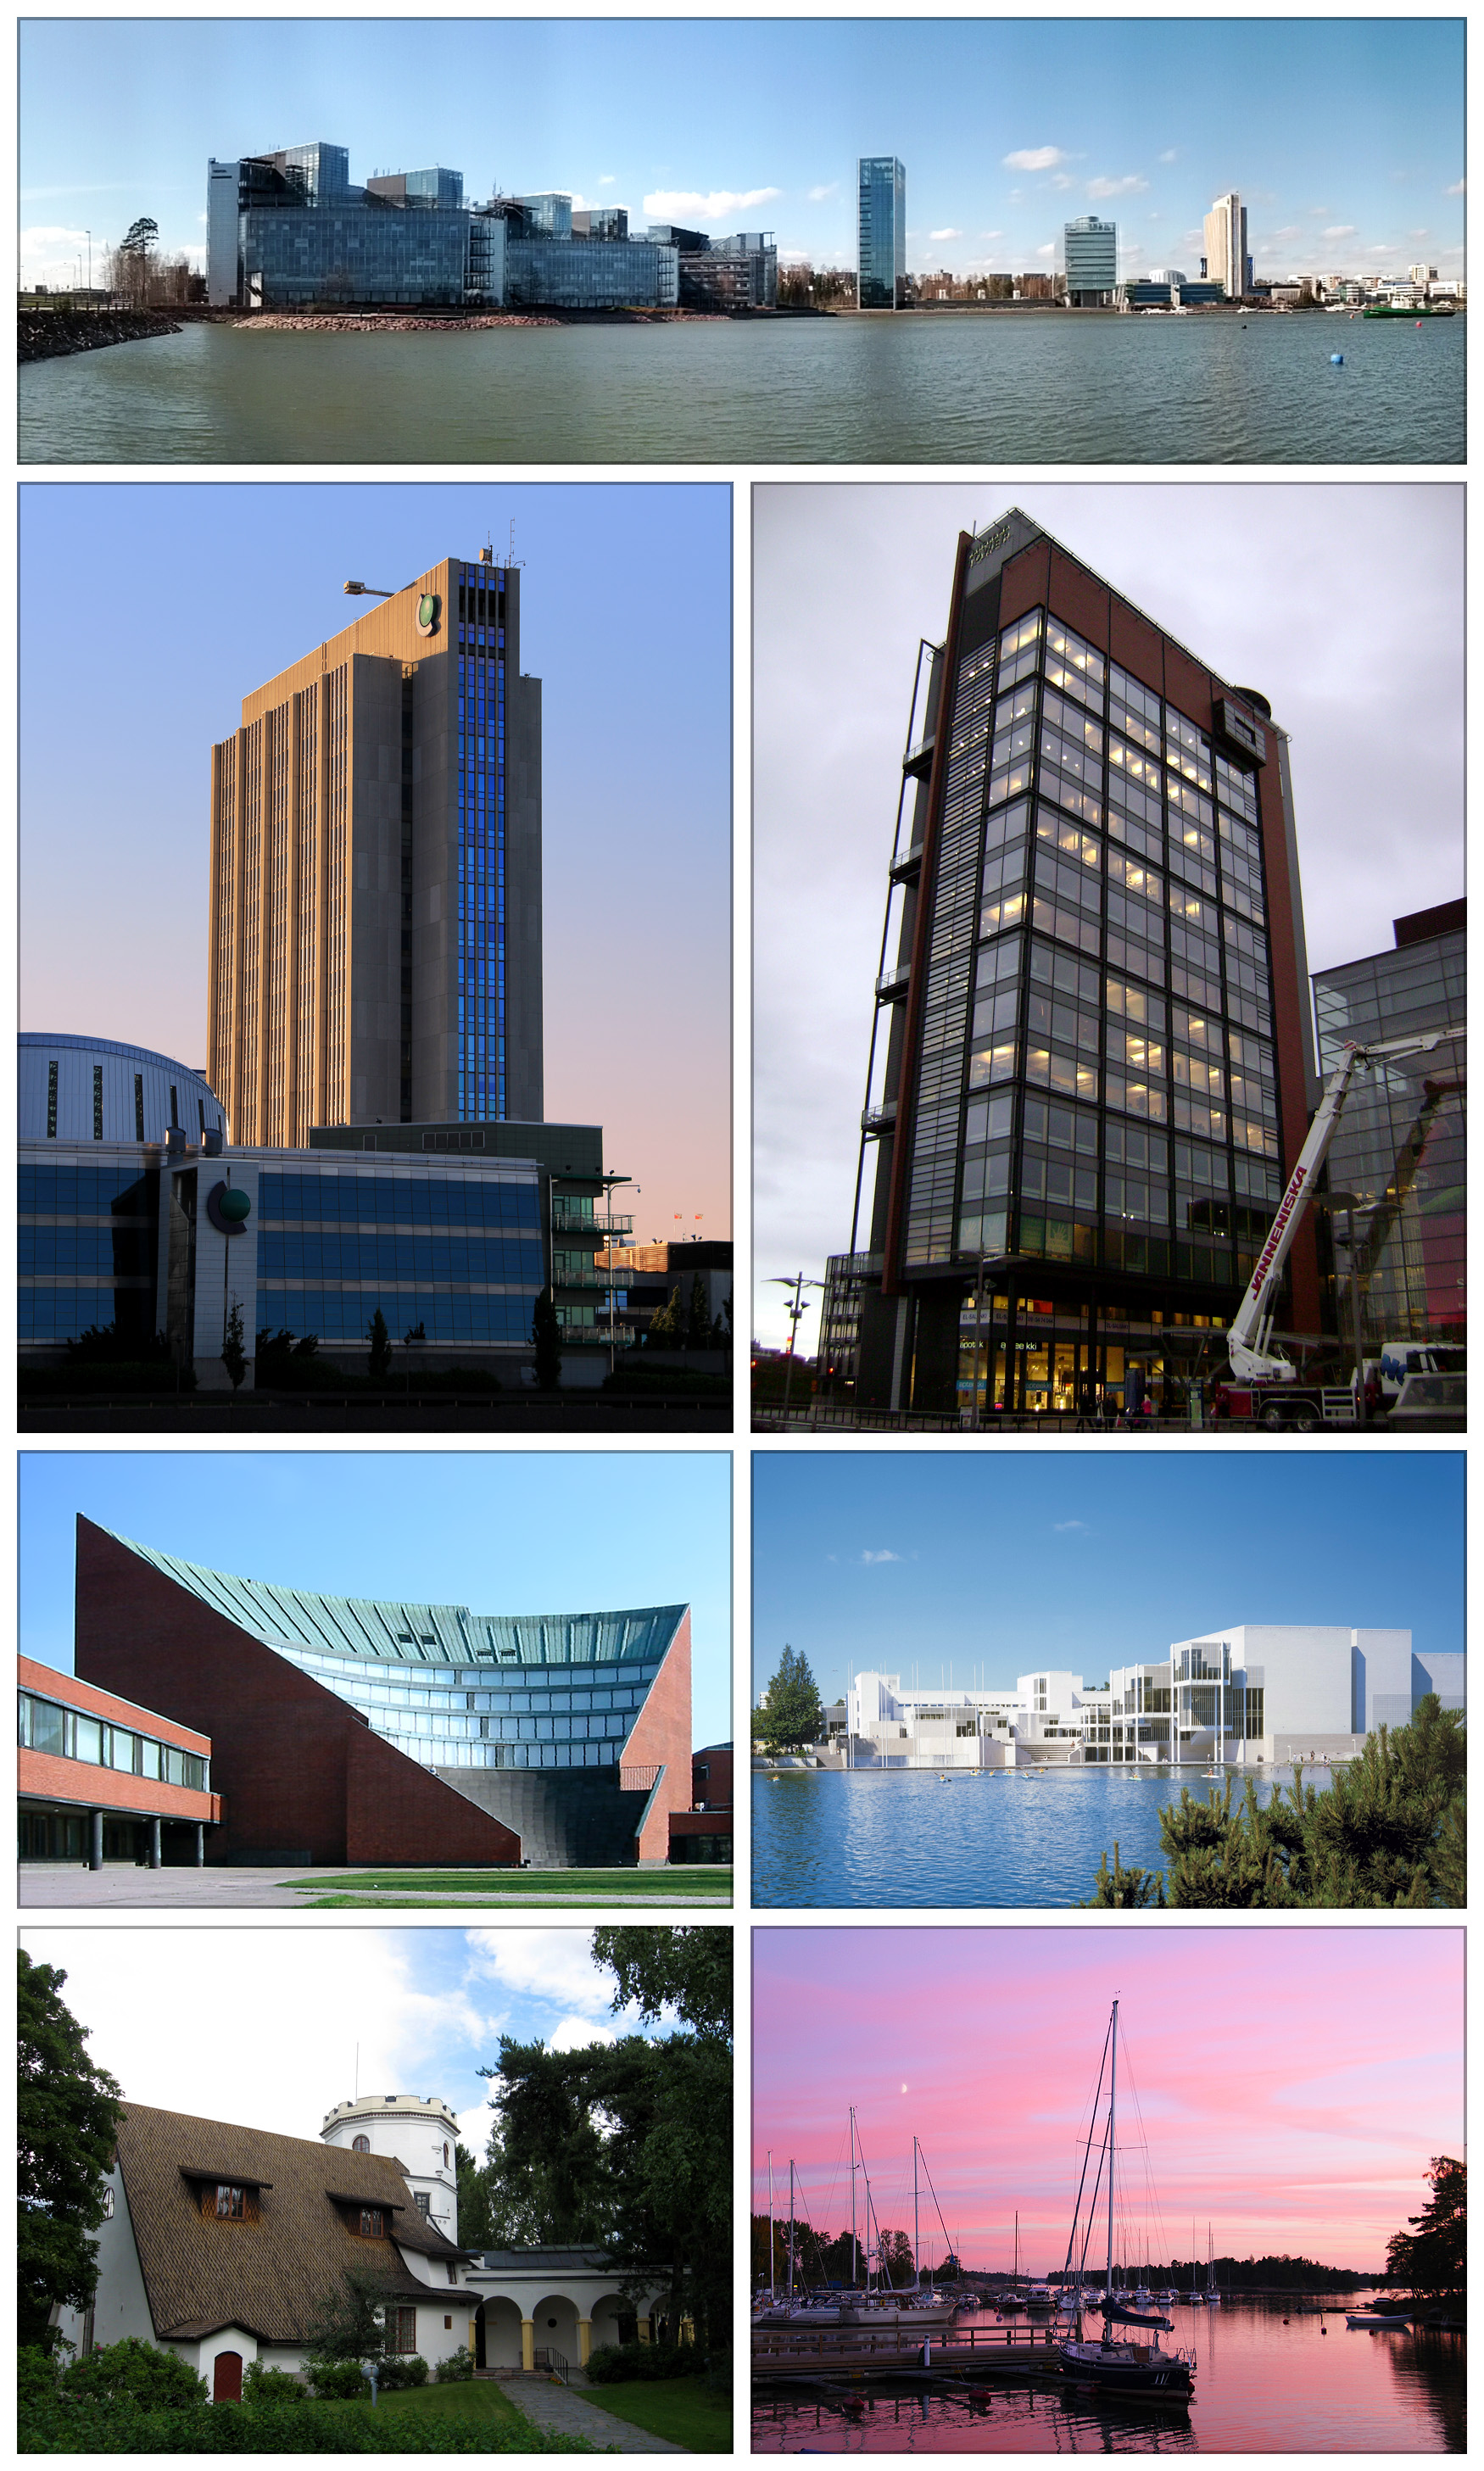
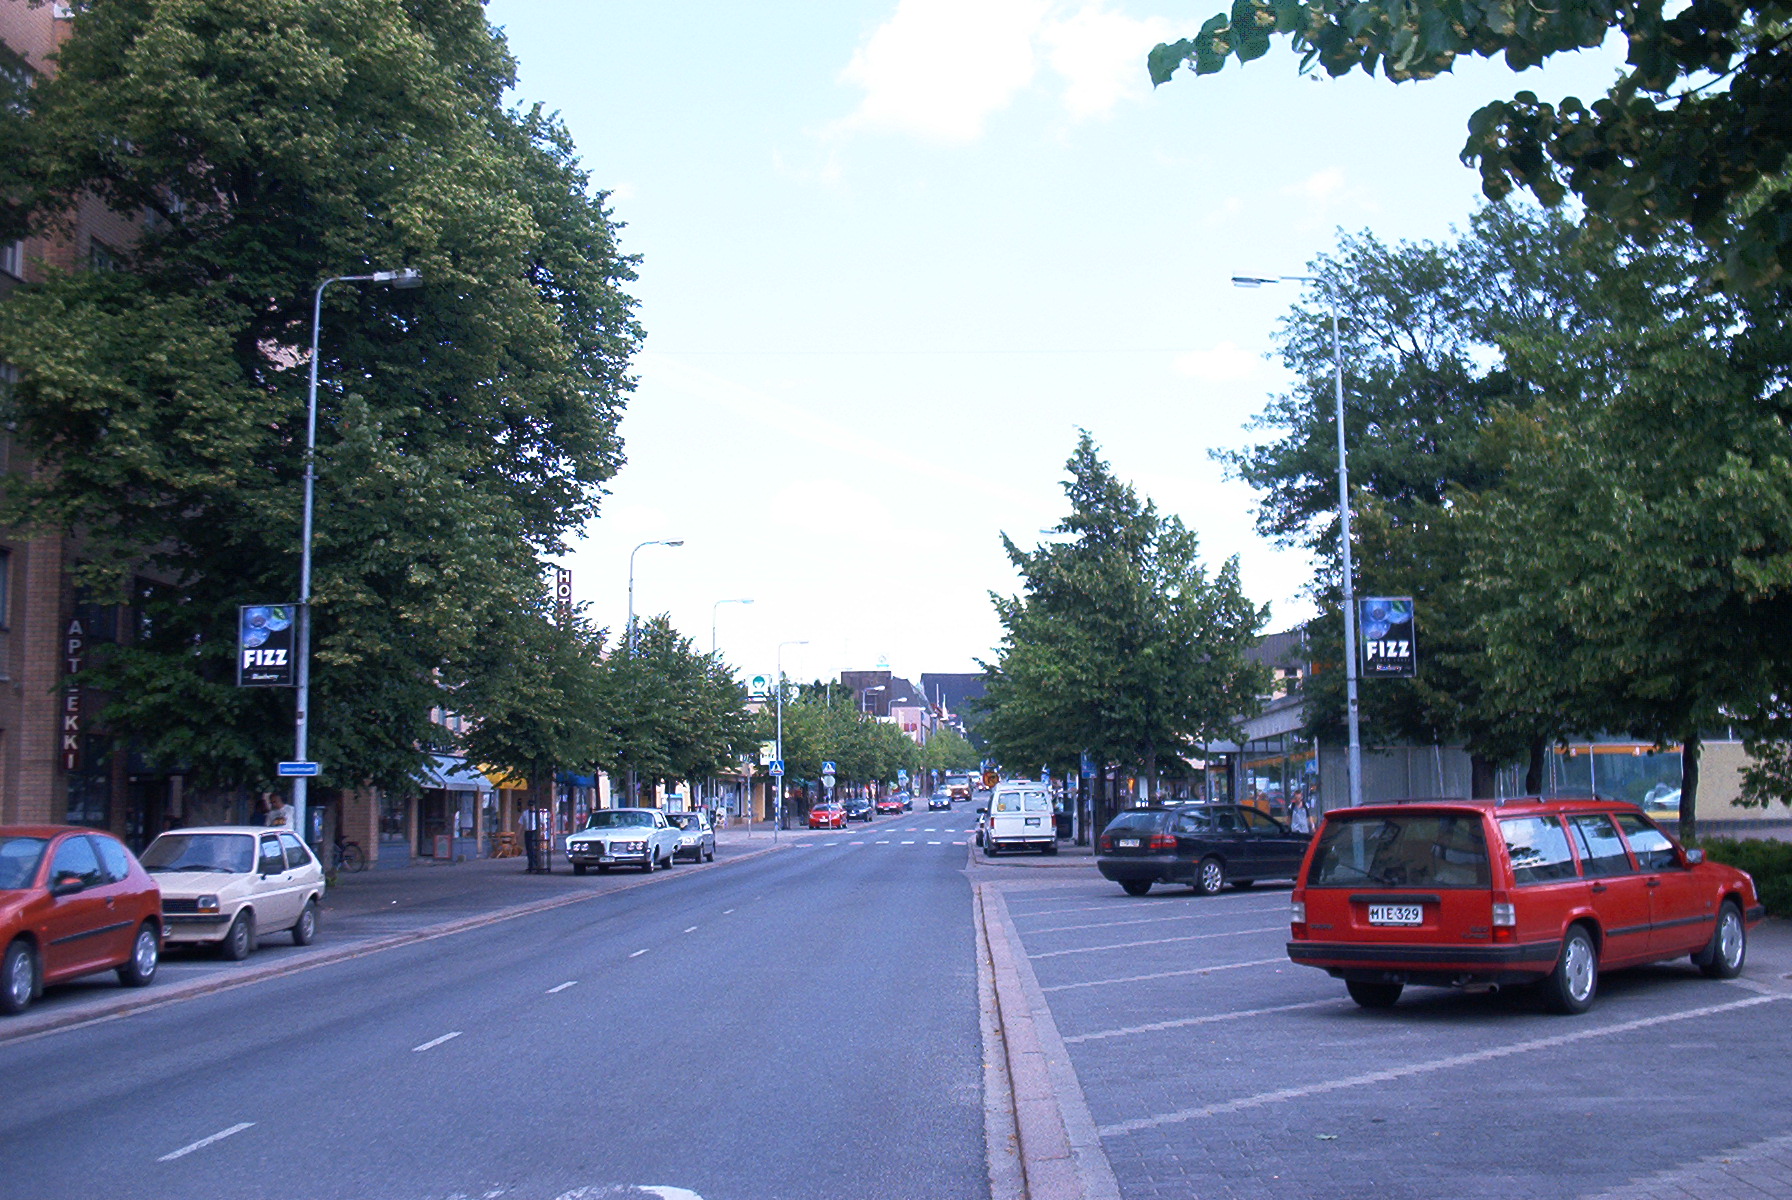
Ingå
Ingå (Swedish pronunciation: [ˈiŋo]; Finnish: Inkoo) is a municipality of Finland. is located in the province of Southern Finland and is part of the Uusimaa region. The municipality has a population of 5,615 (30 June 2015) and covers an area of 954...
Ingå Wikipedia Page

About Our Data
The data on this page is estimated using a number of publicly available tools and resources. It is provided without warranty, and could contain inaccuracies. Use at your own risk.