Industries
Business Distribution by Industry in Nagu
| Industry Description | Number of Establishments | Average Google Rating |
|---|---|---|
| Restaurants | 17 | 4.1 |
Nagu Facts
| Area | 1.3 km² |
| Population | 251 |
| Population change (1975 to 2020) | +46.8% |
| Population change (2000 to 2020) | +1.2% |
| Neighborhoods | Kyrkbacken, 21660, Nagu, Keskusta, Katariina |
| Local Time | |
| Timezone | Eastern European Summer Time |
| Lat & Lng | 60.19375, 21.90972 |
| Postal Codes | 21660 |
Map of Nagu
Interactive Map
Nagu Population
Years 1975 to 2020
| Data | 1975 | 1990 | 2000 | 2015 | 2020 |
|---|---|---|---|---|---|
| Population | 171 | 212 | 248 | 249 | 251 |
| Population Density | 136.8 / km² | 169.6 / km² | 198.4 / km² | 199.2 / km² | 200.8 / km² |
Nagu Population change from 2000 to 2015
Increase of 0.4% from year 2000 to 2015
| Location | Change since 1975 | Change since 1990 | Change since 2000 |
|---|---|---|---|
| Nagu | +45.6% | +17.5% | +0.4% |
| Southwest Finland | +14.9% | +8.4% | +4.9% |
| Finland | +16.3% | +10.2% | +6.2% |
Nagu Population Density
Population Density: 201 / km²
| Location | Population | Area | Density |
|---|---|---|---|
| Nagu | 251 | 1.25 km² | 201 / km² |
| Southwest Finland | 473,224 | 20,538.1 km² | 23 / km² |
| Finland | 5.3 million | 334,788.7 km² | 15.9 / km² |
Nagu Historical and Projected Population
Estimated Population from 1700 to 2100
- JRC (European Commission's Joint Research Centre) work on the GHS built-up grid
- CIESIN (Center for International Earth Science Information Network)
- [Link] Klein Goldewijk, K., Beusen, A., Doelman, J., and Stehfest, E.: Anthropogenic land use estimates for the Holocene – HYDE 3.2, Earth Syst. Sci. Data, 9, 927–953, https://doi.org/10.5194/essd-9-927-2017, 2017.
Neighborhoods in Nagu
Percentage of businesses by neighborhood in Nagu
Area Codes
Percentage Area Codes used by businesses in Nagu
Price Distribution
Business distribution by price for Nagu
Human Development Index (HDI)
Statistic composite index of life expectancy, education, and per capita income.
Nagu CO2 Emissions
Carbon Dioxide (CO2) Emissions Per Capita in Tonnes Per Year
| Location | CO2 Emissions | CO2 Emissions Per Capita | CO2 Emissions Intensity |
|---|---|---|---|
| Nagu | 3,821 tn | 15.22 tn | 3,056.9 tons/km² |
| Southwest Finland | 3,747,927 tn | 7.92 tn | 182.5 tons/km² |
| Finland | 54,177,521 tn | 10.19 tn | 161.8 tons/km² |
| 2013 CO2 emissions (tonnes/year) | 3,821 tn |
| 2013 CO2 emissions (tonnes/year) per capita | 15.22 tn |
| 2013 CO2 emissions intensity (tonnes/km²/year) | 3,056.9 tons/km² |
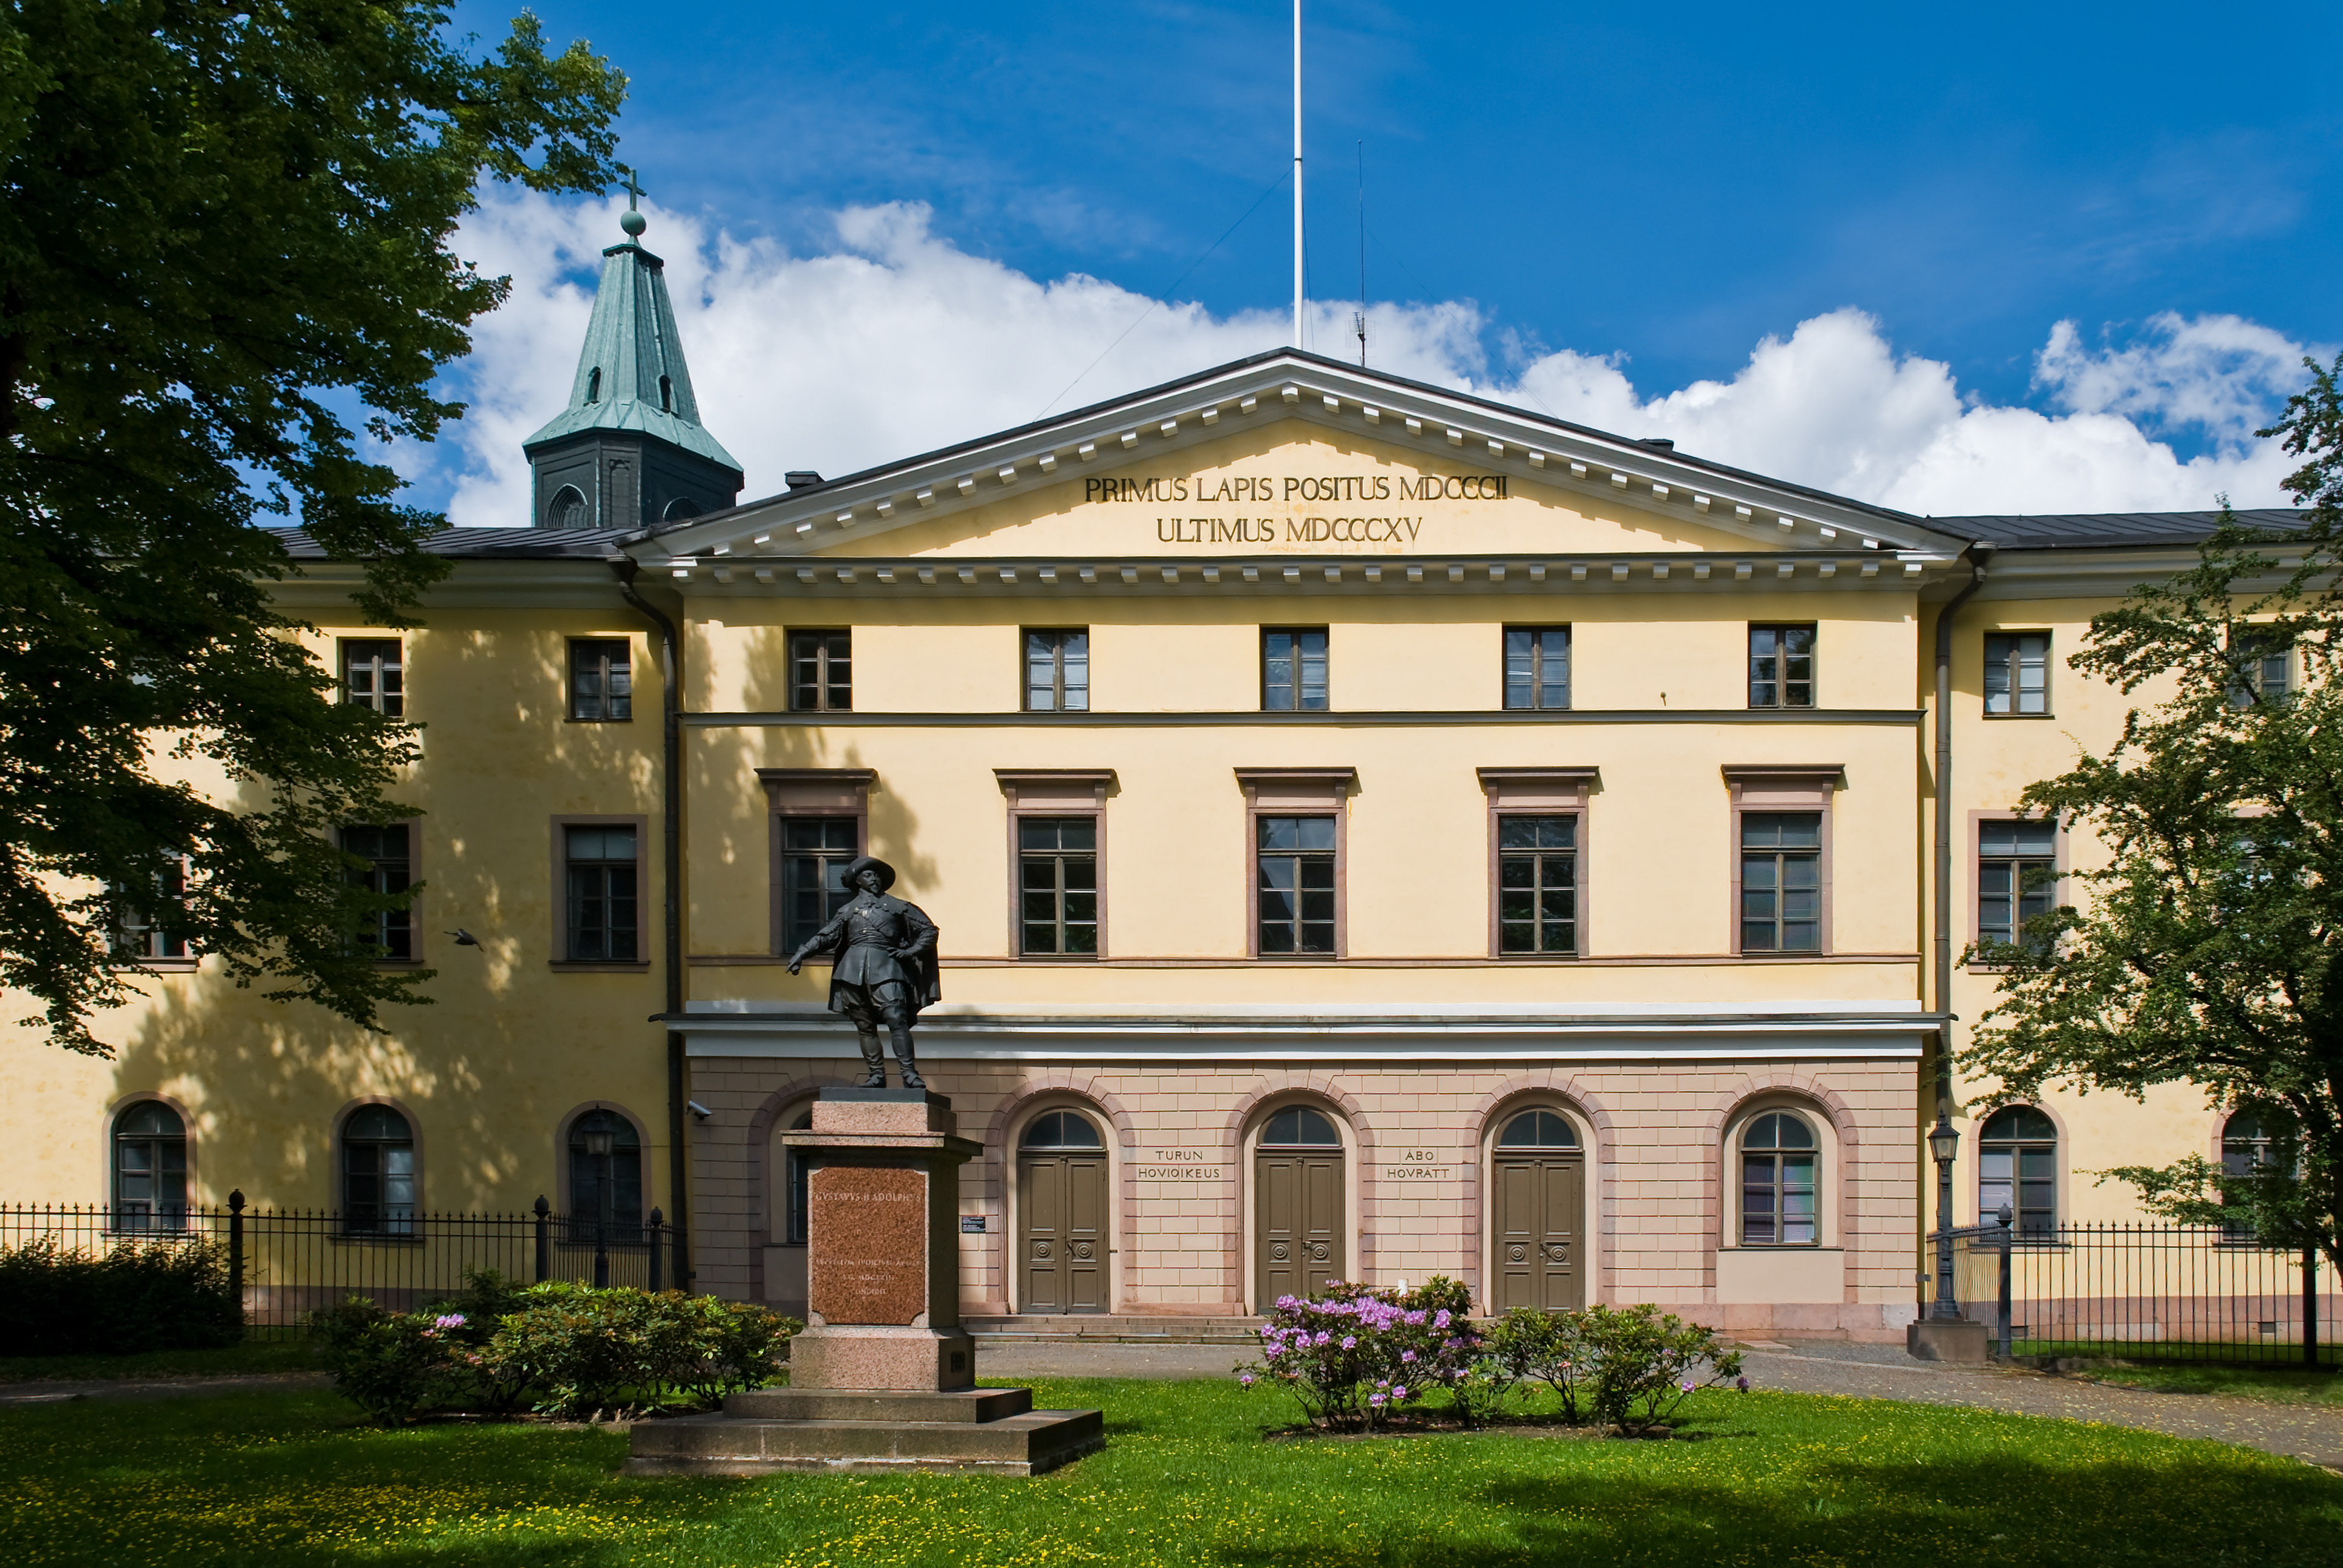
Nagu
Nagu (Swedish pronunciation: [naːɡʉ]; Finnish: Nauvo, [ˈnɑuʋo]) is a former municipality of Finland. On 1 January 2009, it was consolidated with Houtskär, Iniö, Korpo and Pargas to form the new town of Väståboland. On 1 January 2012 the name Väståbol..
Nagu Wikipedia Page


About Our Data
The data on this page is estimated using a number of publicly available tools and resources. It is provided without warranty, and could contain inaccuracies. Use at your own risk.