Categories in Eaunes
Car repairCar Repair and MaintenanceAssociation or OrganizationCity or Town HallConstruction of buildingsElectricianFlooring ContractorPainting and paint contractorsPlumbing installation and repairRoofing contractorAdult Education SchoolBakeriesCatererPizzaRestaurantsEarth Works CompanyFurniture storesBanksAlternative medicineDentistsNursing AgencyBeauty salonsHairdresserHair SalonBusiness Management ConsultantReal Estate AgencyResidential Property RentalsSupermarketGym
Industries
Business Distribution by Industry in Eaunes
| Industry Description | Number of Establishments | Average Age of Business |
|---|---|---|
| Hairdressers | 15 | — |
| Restaurants | 15 | — |
| Shopping | 13 | 26 years |
| Alternative medicine | 13 | — |
| Corporate management | 12 | — |
| Car repair | 12 | — |
| Public administration | 11 | — |
| Construction of buildings | 11 | — |
| Grocery stores and supermarkets | 10 | — |
| Other construction | 10 | — |
| Other accommodation | 9 | — |
| Shopping other | 8 | — |
| Electrical installation | 8 | — |
| Health and medical | 8 | — |
| Real estate | 7 | — |
| General contractors | 7 | — |
Eaunes Facts
| Area | 15.1 km² |
| Population | 5,662 |
| Male Population | 2,787 (49.2%) |
| Female Population | 2,875 (50.8%) |
| Population change (1975 to 2020) | +246.5% |
| Population change (2000 to 2020) | +60.5% |
| Median Age | 38.5 years (Male: 38.9, Female: 38.3) |
| Local Time | |
| Timezone | Central European Summer Time |
| Lat & Lng | 43.42079, 1.35397 |
Map of Eaunes
Interactive Map
Eaunes Population
Years 1975 to 2020
| Data | 1975 | 1990 | 2000 | 2015 | 2020 |
|---|---|---|---|---|---|
| Population | 1,634 | 2,585 | 3,527 | 5,469 | 5,662 |
| Population Density | 108.5 / km² | 171.6 / km² | 234.2 / km² | 363.1 / km² | 375.9 / km² |
Sources: JRC (European Commission's Joint Research Centre) work on the GHS built-up grid
Eaunes Population change from 2000 to 2015
Increase of 55.1% from year 2000 to 2015
| Location | Change since 1975 | Change since 1990 | Change since 2000 |
|---|---|---|---|
| Eaunes | +234.7% | +111.6% | +55.1% |
| France | +22.7% | +13.8% | +8.8% |
Sources: JRC (European Commission's Joint Research Centre) work on the GHS built-up grid
Eaunes Median Age
Median Age: 38.5 years
| Location | Median Age | Median Age (Female) | Median Age (Male) |
|---|---|---|---|
| Eaunes | 38.5 yrs | 38.3 yrs | 38.9 yrs |
| France | 39.6 yrs | 41 yrs | 38.1 yrs |
Sources: CIESIN (Center for International Earth Science Information Network)
Eaunes Population Density
Population Density: 376 / km²
| Location | Population | Area | Density |
|---|---|---|---|
| Eaunes | 5,662 | 15.1 km² | 376 / km² |
| France | 65.9 million | 638,022.5 km² | 103 / km² |
Sources: JRC (European Commission's Joint Research Centre) work on the GHS built-up grid
Eaunes Historical and Projected Population
Estimated Population from 1200 to 2100
Sources:
- JRC (European Commission's Joint Research Centre) work on the GHS built-up grid
- CIESIN (Center for International Earth Science Information Network)
- [Link] Klein Goldewijk, K., Beusen, A., Doelman, J., and Stehfest, E.: Anthropogenic land use estimates for the Holocene – HYDE 3.2, Earth Syst. Sci. Data, 9, 927–953, https://doi.org/10.5194/essd-9-927-2017, 2017.
Area Codes
Percentage Area Codes used by businesses in Eaunes
Human Development Index (HDI)
Statistic composite index of life expectancy, education, and per capita income.
Source: [Link] Kummu, M., Taka, M. &Guillaume, J. Gridded global datasets for Gross Domestic Product and Human Development Index over 1990–2015. Sci Data 5, 180004 (2018) doi:10.1038/sdata.2018.4
Eaunes CO2 Emissions
Carbon Dioxide (CO2) Emissions Per Capita in Tonnes Per Year
| Location | CO2 Emissions | CO2 Emissions Per Capita | CO2 Emissions Intensity |
|---|---|---|---|
| Eaunes | 45,308 tn | 8 tn | 3,008 tons/km² |
| France | 485,797,691 tn | 7.38 tn | 761.4 tons/km² |
Sources: [Link] Moran, D., Kanemoto K; Jiborn, M., Wood, R., Többen, J., and Seto, K.C. (2018) Carbon footprints of 13,000 cities. Environmental Research Letters DOI: 10.1088/1748-9326/aac72a
Eaunes CO2 Emissions
| 2013 CO2 emissions (tonnes/year) | 45,308 tn |
| 2013 CO2 emissions (tonnes/year) per capita | 8 tn |
| 2013 CO2 emissions intensity (tonnes/km²/year) | 3,008 tons/km² |
Recent Nearby Earthquakes
Magnitude 3.0 and greater
| Date▼ | Time↕ | Magnitude↕ | Distance↕ | Depth↕ | Location↕ | Link |
|---|---|---|---|---|---|---|
| 8/6/18 | 8:49 PM | 3.5 | 97.1 km | 10,000 m | 8km ENE of Campan, France | usgs.gov |
| 5/18/08 | 2:49 PM | 3.3 | 95.7 km | 5,000 m | Pyrenees | usgs.gov |
| 12/26/07 | 8:37 AM | 3 | 99 km | 5,000 m | Pyrenees | usgs.gov |
| 9/11/07 | 8:49 AM | 3.6 | 97.7 km | 5,000 m | Pyrenees | usgs.gov |
| 5/8/06 | 9:47 PM | 3.6 | 87.2 km | 5,000 m | Pyrenees | usgs.gov |
| 8/29/05 | 12:11 PM | 3 | 88.3 km | 2,000 m | Pyrenees | usgs.gov |
| 3/29/05 | 8:16 AM | 3.1 | 99.7 km | 5,000 m | Pyrenees | usgs.gov |
| 1/15/05 | 7:13 AM | 3.7 | 83.7 km | 11,100 m | Pyrenees | usgs.gov |
| 7/23/04 | 9:25 AM | 3.1 | 86 km | 10,000 m | Pyrenees | usgs.gov |
| 7/18/04 | 2:16 AM | 3.8 | 61.2 km | 10,000 m | Pyrenees | usgs.gov |
Source: U.S. Geological Survey (USGS)
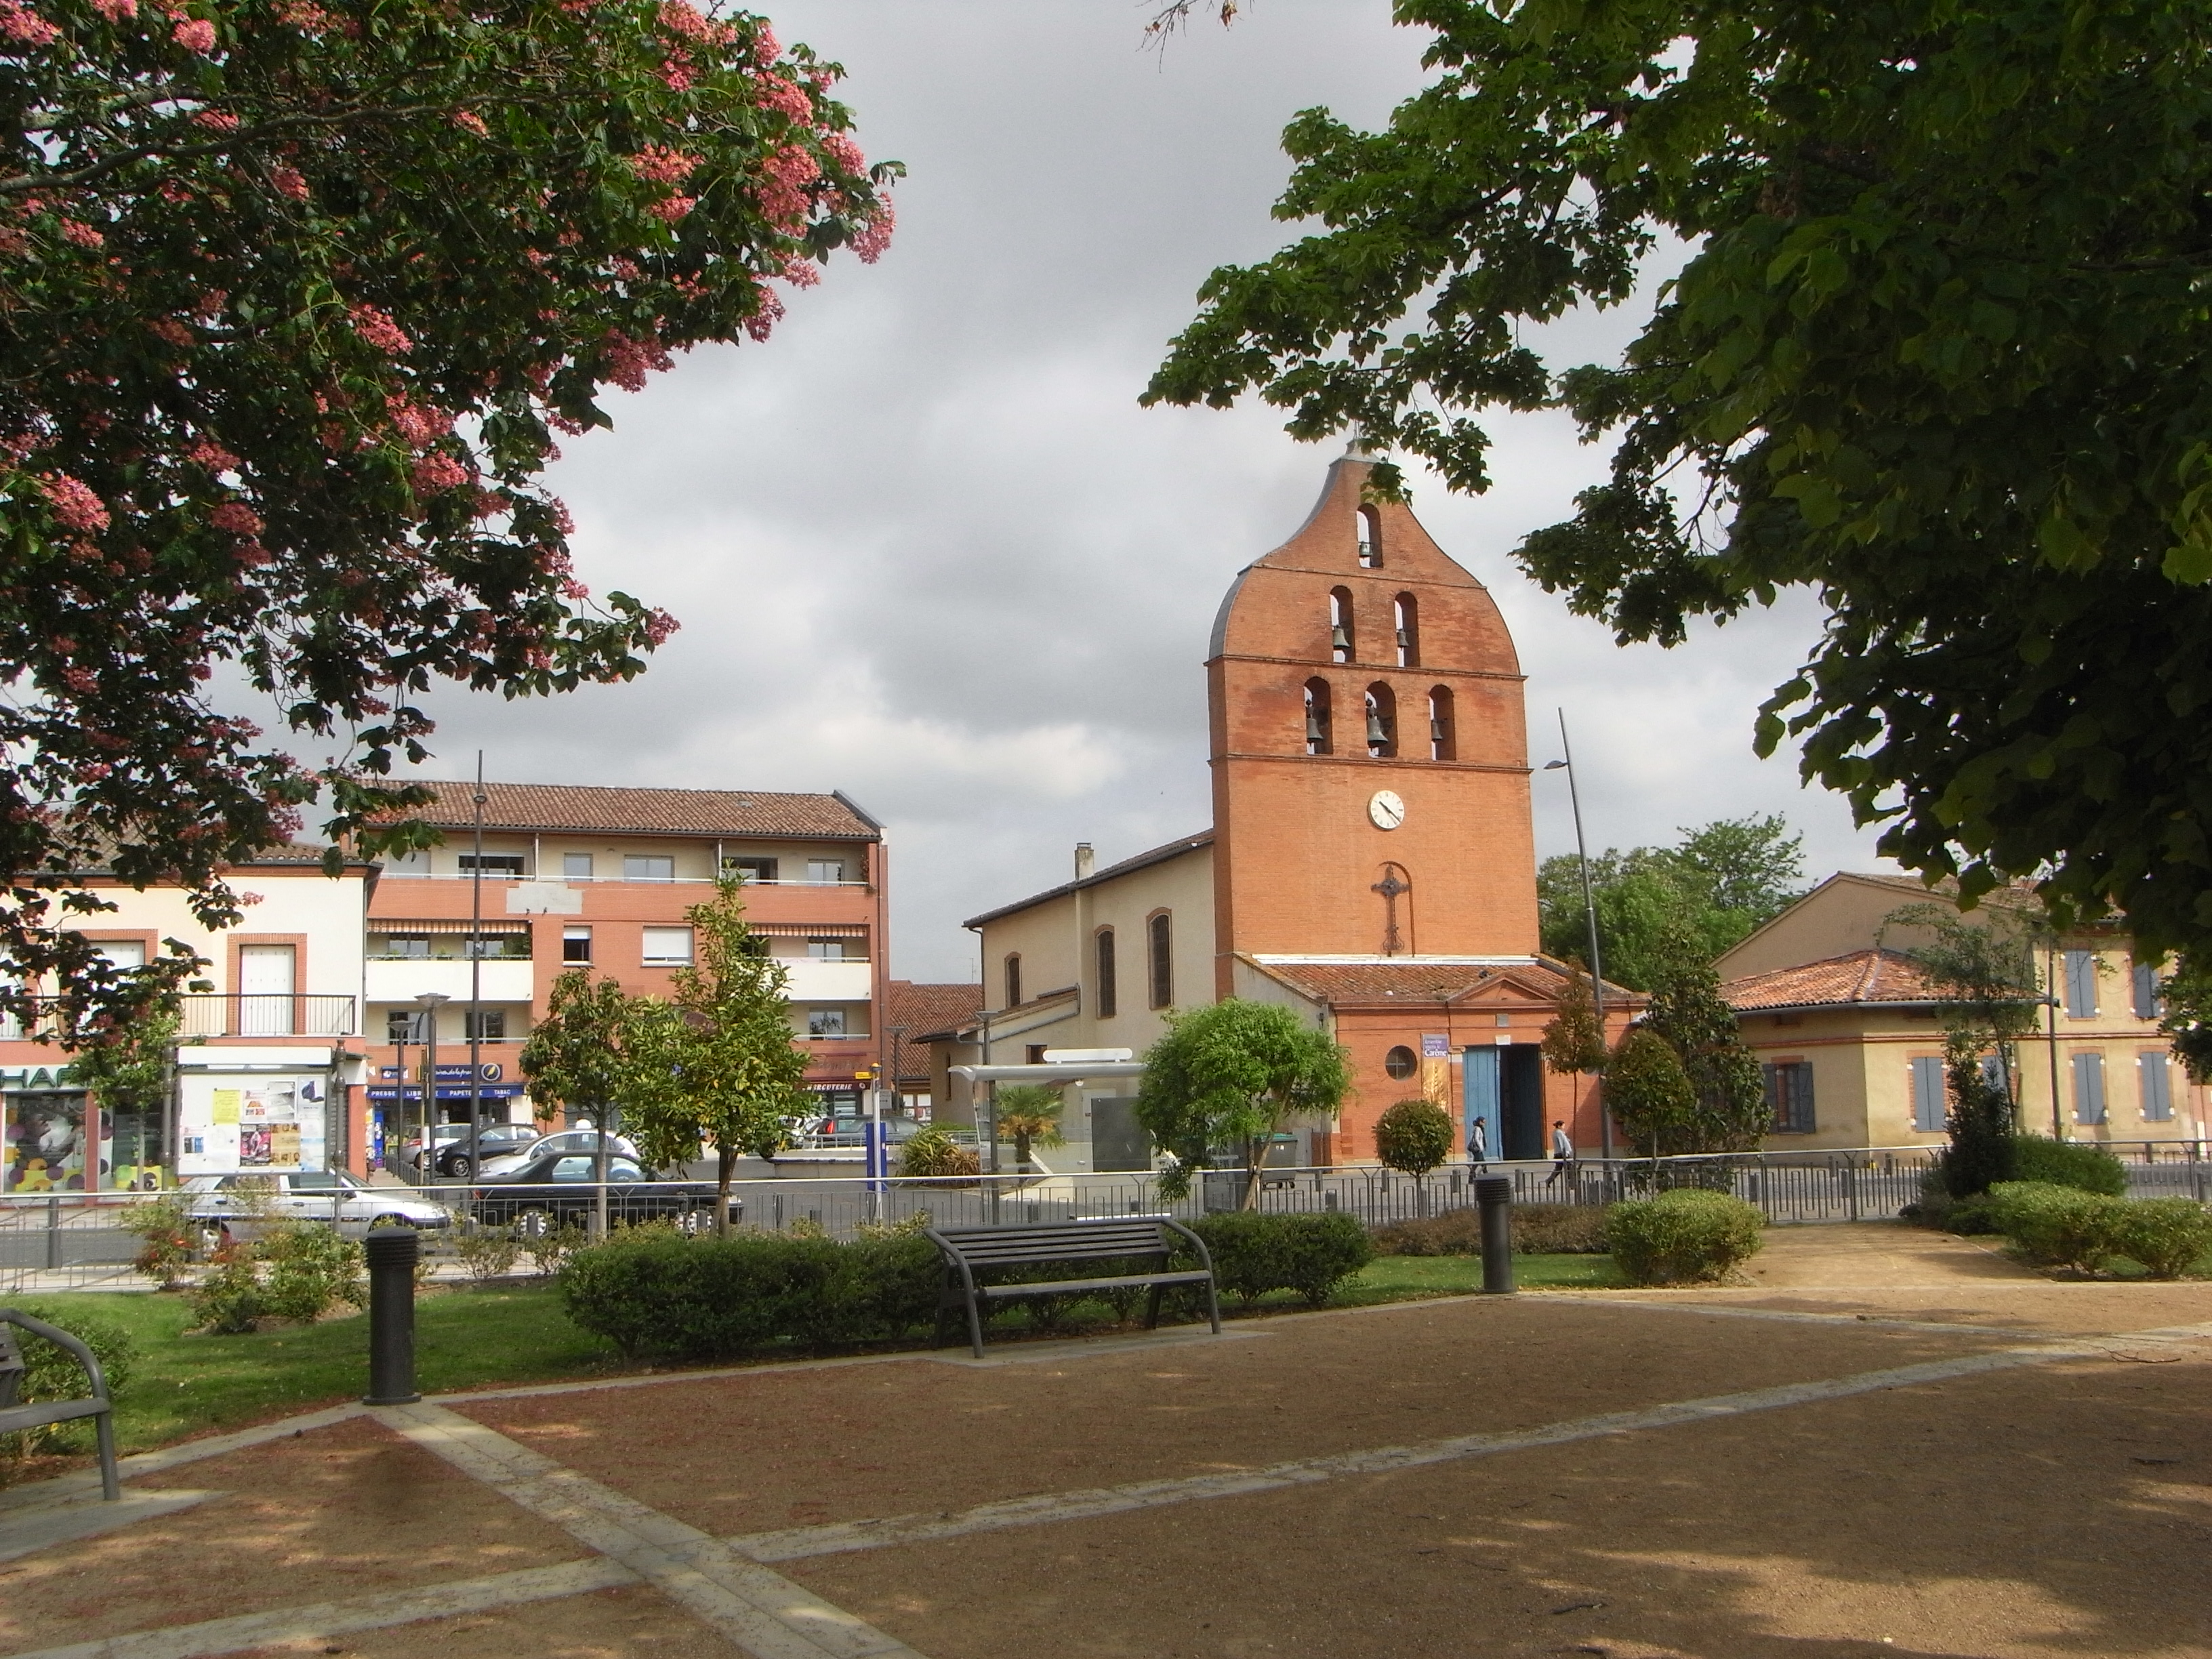
Eaunes
Eaunes is a commune in the Haute-Garonne department in southwestern France.
Eaunes Wikipedia Page


About Our Data
The data on this page is estimated using a number of publicly available tools and resources. It is provided without warranty, and could contain inaccuracies. Use at your own risk.