Categories in Groix
Industries
Business Distribution by Industry in Groix
| Industry Description | Number of Establishments | Average Age of Business |
|---|---|---|
| Other accommodation | 49 | — |
| Restaurants | 33 | 11 years |
| Travel agencies | 19 | — |
| Bed and breakfasts | 16 | — |
| Real estate | 14 | — |
| Shopping | 14 | — |
| Public administration | 10 | — |
| Bars, pubs and taverns | 9 | — |
| Sports and recreation | 8 | — |
| Holiday homes, cabins and resorts | 8 | — |
| Grocery stores and supermarkets | 8 | — |
| Construction of buildings | 7 | — |
| Bakeries | 7 | — |
| Shopping other | 7 | — |
| Hotels and motels | 6 | — |
| Corporate management | 6 | — |
| Churches | 6 | — |
| Nurses | 6 | — |
Groix Facts
| Area | 15.1 km² |
| Population | 1,794 |
| Male Population | 847 (47.2%) |
| Female Population | 947 (52.8%) |
| Population change (1975 to 2020) | -13.0% |
| Population change (2000 to 2020) | -13.4% |
| Median Age | 55.9 years (Male: 54.4, Female: 57.2) |
| Local Time | |
| Timezone | Central European Summer Time |
| Lat & Lng | 47.63887, -3.45430 |
| Postal Codes | 56590 |
Map of Groix
Interactive Map
Groix Population
Years 1975 to 2030
| Data | 1975 | 1990 | 2000 | 2015 | 2020 | 2025* | 2030* |
|---|---|---|---|---|---|---|---|
| Population | 2,061 | 2,089 | 2,071 | 2,030 | 1,794 | 1,675 | 1,599 |
| Population Density | 136.3 / km² | 138.1 / km² | 136.9 / km² | 134.2 / km² | 118.6 / km² | 110.7 / km² | 105.7 / km² |
Groix Population change from 2000 to 2020
Decrease of 13.4% from year 2000 to 2020
| Location | Change since 1975 | Change since 1990 | Change since 2000 |
|---|---|---|---|
| Groix | -13% | -14.1% | -13.4% |
| France | — | — | — |
Groix Median Age
Median Age: 55.9 years
| Location | Median Age | Median Age (Female) | Median Age (Male) |
|---|---|---|---|
| Groix | 55.9 yrs | 57.2 yrs | 54.4 yrs |
| France | 39.6 yrs | 41 yrs | 38.1 yrs |
Groix Population Density
Population Density: 119 / km²
| Location | Population | Area | Density |
|---|---|---|---|
| Groix | 1,794 | 15.1 km² | 119 / km² |
| France | 65.9 million | 638,022.5 km² | 103 / km² |
Groix Historical and Projected Population
Estimated Population from 1975 to 2100
- JRC (European Commission's Joint Research Centre) work on the GHS built-up grid
- CIESIN (Center for International Earth Science Information Network)
- [Link] Klein Goldewijk, K., Beusen, A., Doelman, J., and Stehfest, E.: Anthropogenic land use estimates for the Holocene – HYDE 3.2, Earth Syst. Sci. Data, 9, 927–953, https://doi.org/10.5194/essd-9-927-2017, 2017.
Area Codes
Percentage Area Codes used by businesses in Groix
Price Distribution
Business distribution by price for Groix
Human Development Index (HDI)
Statistic composite index of life expectancy, education, and per capita income.
France CO2 Emissions
Carbon Dioxide (CO2) Emissions Per Capita in Tonnes Per Year
| Location | CO2 Emissions | CO2 Emissions Per Capita | CO2 Emissions Intensity |
|---|---|---|---|
| France | 485,797,691 tn | 7.38 tn | 761.4 tons/km² |
| 2013 CO2 emissions (tonnes/year) | 485,797,691 tn |
| 2013 CO2 emissions (tonnes/year) per capita | 7.38 tn |
| 2013 CO2 emissions intensity (tonnes/km²/year) | 761.4 tons/km² |
Natural Hazards Risk
Relative risk out of 10
| Hazard | Risk Level |
|---|---|
| Drought | Low (2) |
| Earthquake | Low (2.2) |
* Risk, particularly concerning flood or landslide, may not be for the entire area.
- Dilley, M., R.S. Chen, U. Deichmann, A.L. Lerner-Lam, M. Arnold, J. Agwe, P. Buys, O. Kjekstad, B. Lyon, and G. Yetman. 2005. Natural Disaster Hotspots: A Global Risk Analysis. Washington, D.C.: World Bank. https://doi.org/10.1596/0-8213-5930-4.
- Center for Hazards and Risk Research - CHRR - Columbia University, Center for International Earth Science Information Network - CIESIN - Columbia University, and International Research Institute for Climate and Society - IRI - Columbia University. 2005. Global Drought Hazard Frequency and Distribution. Palisades, NY: NASA Socioeconomic Data and Applications Center (SEDAC). https://doi.org/10.7927/H4VX0DFT.
- Center for Hazards and Risk Research - CHRR - Columbia University, Center for International Earth Science Information Network - CIESIN - Columbia University. 2005. Global Earthquake Hazard Distribution - Peak Ground Acceleration. Palisades, NY: NASA Socioeconomic Data and Applications Center (SEDAC). https://doi.org/10.7927/H4BZ63ZS.
Recent Nearby Earthquakes
Magnitude 3.0 and greater
| Date▼ | Time↕ | Magnitude↕ | Distance↕ | Depth↕ | Location↕ | Link |
|---|---|---|---|---|---|---|
| 12/11/13 | 10:49 PM | 3.5 | 91.7 km | 2,000 m | 6km S of Hopital-Camfrout, France | usgs.gov |
| 11/21/13 | 9:53 AM | 4.5 | 47.5 km | 4,000 m | 1km WSW of Plescop, France | usgs.gov |
| 8/23/08 | 8:57 AM | 3.2 | 66.3 km | 10,600 m | France | usgs.gov |
| 10/8/07 | 3:50 AM | 3.5 | 64.6 km | 11,300 m | France | usgs.gov |
| 3/16/07 | 7:36 AM | 3 | 94.1 km | 4,000 m | France | usgs.gov |
| 10/30/06 | 12:39 AM | 3.1 | 90.3 km | 20,000 m | France | usgs.gov |
| 4/7/05 | 5:38 PM | 3.8 | 96.6 km | 0 m | France | usgs.gov |
| 3/10/05 | 10:21 AM | 3.1 | 70.6 km | 9,700 m | France | usgs.gov |
| 2/9/05 | 9:13 AM | 3.4 | 33.9 km | 10,000 m | France | usgs.gov |
| 7/18/04 | 2:41 PM | 3 | 1.4 km | 15,000 m | France | usgs.gov |
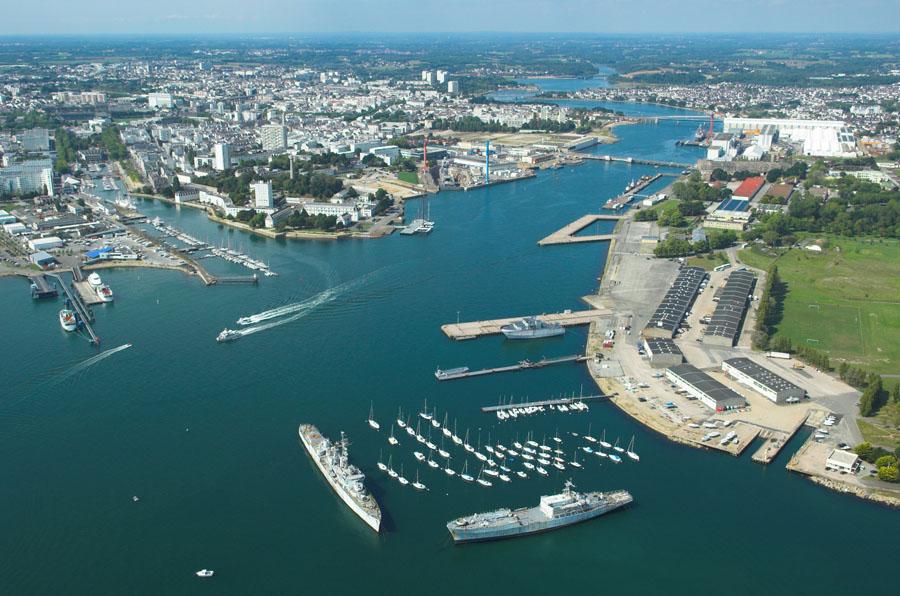
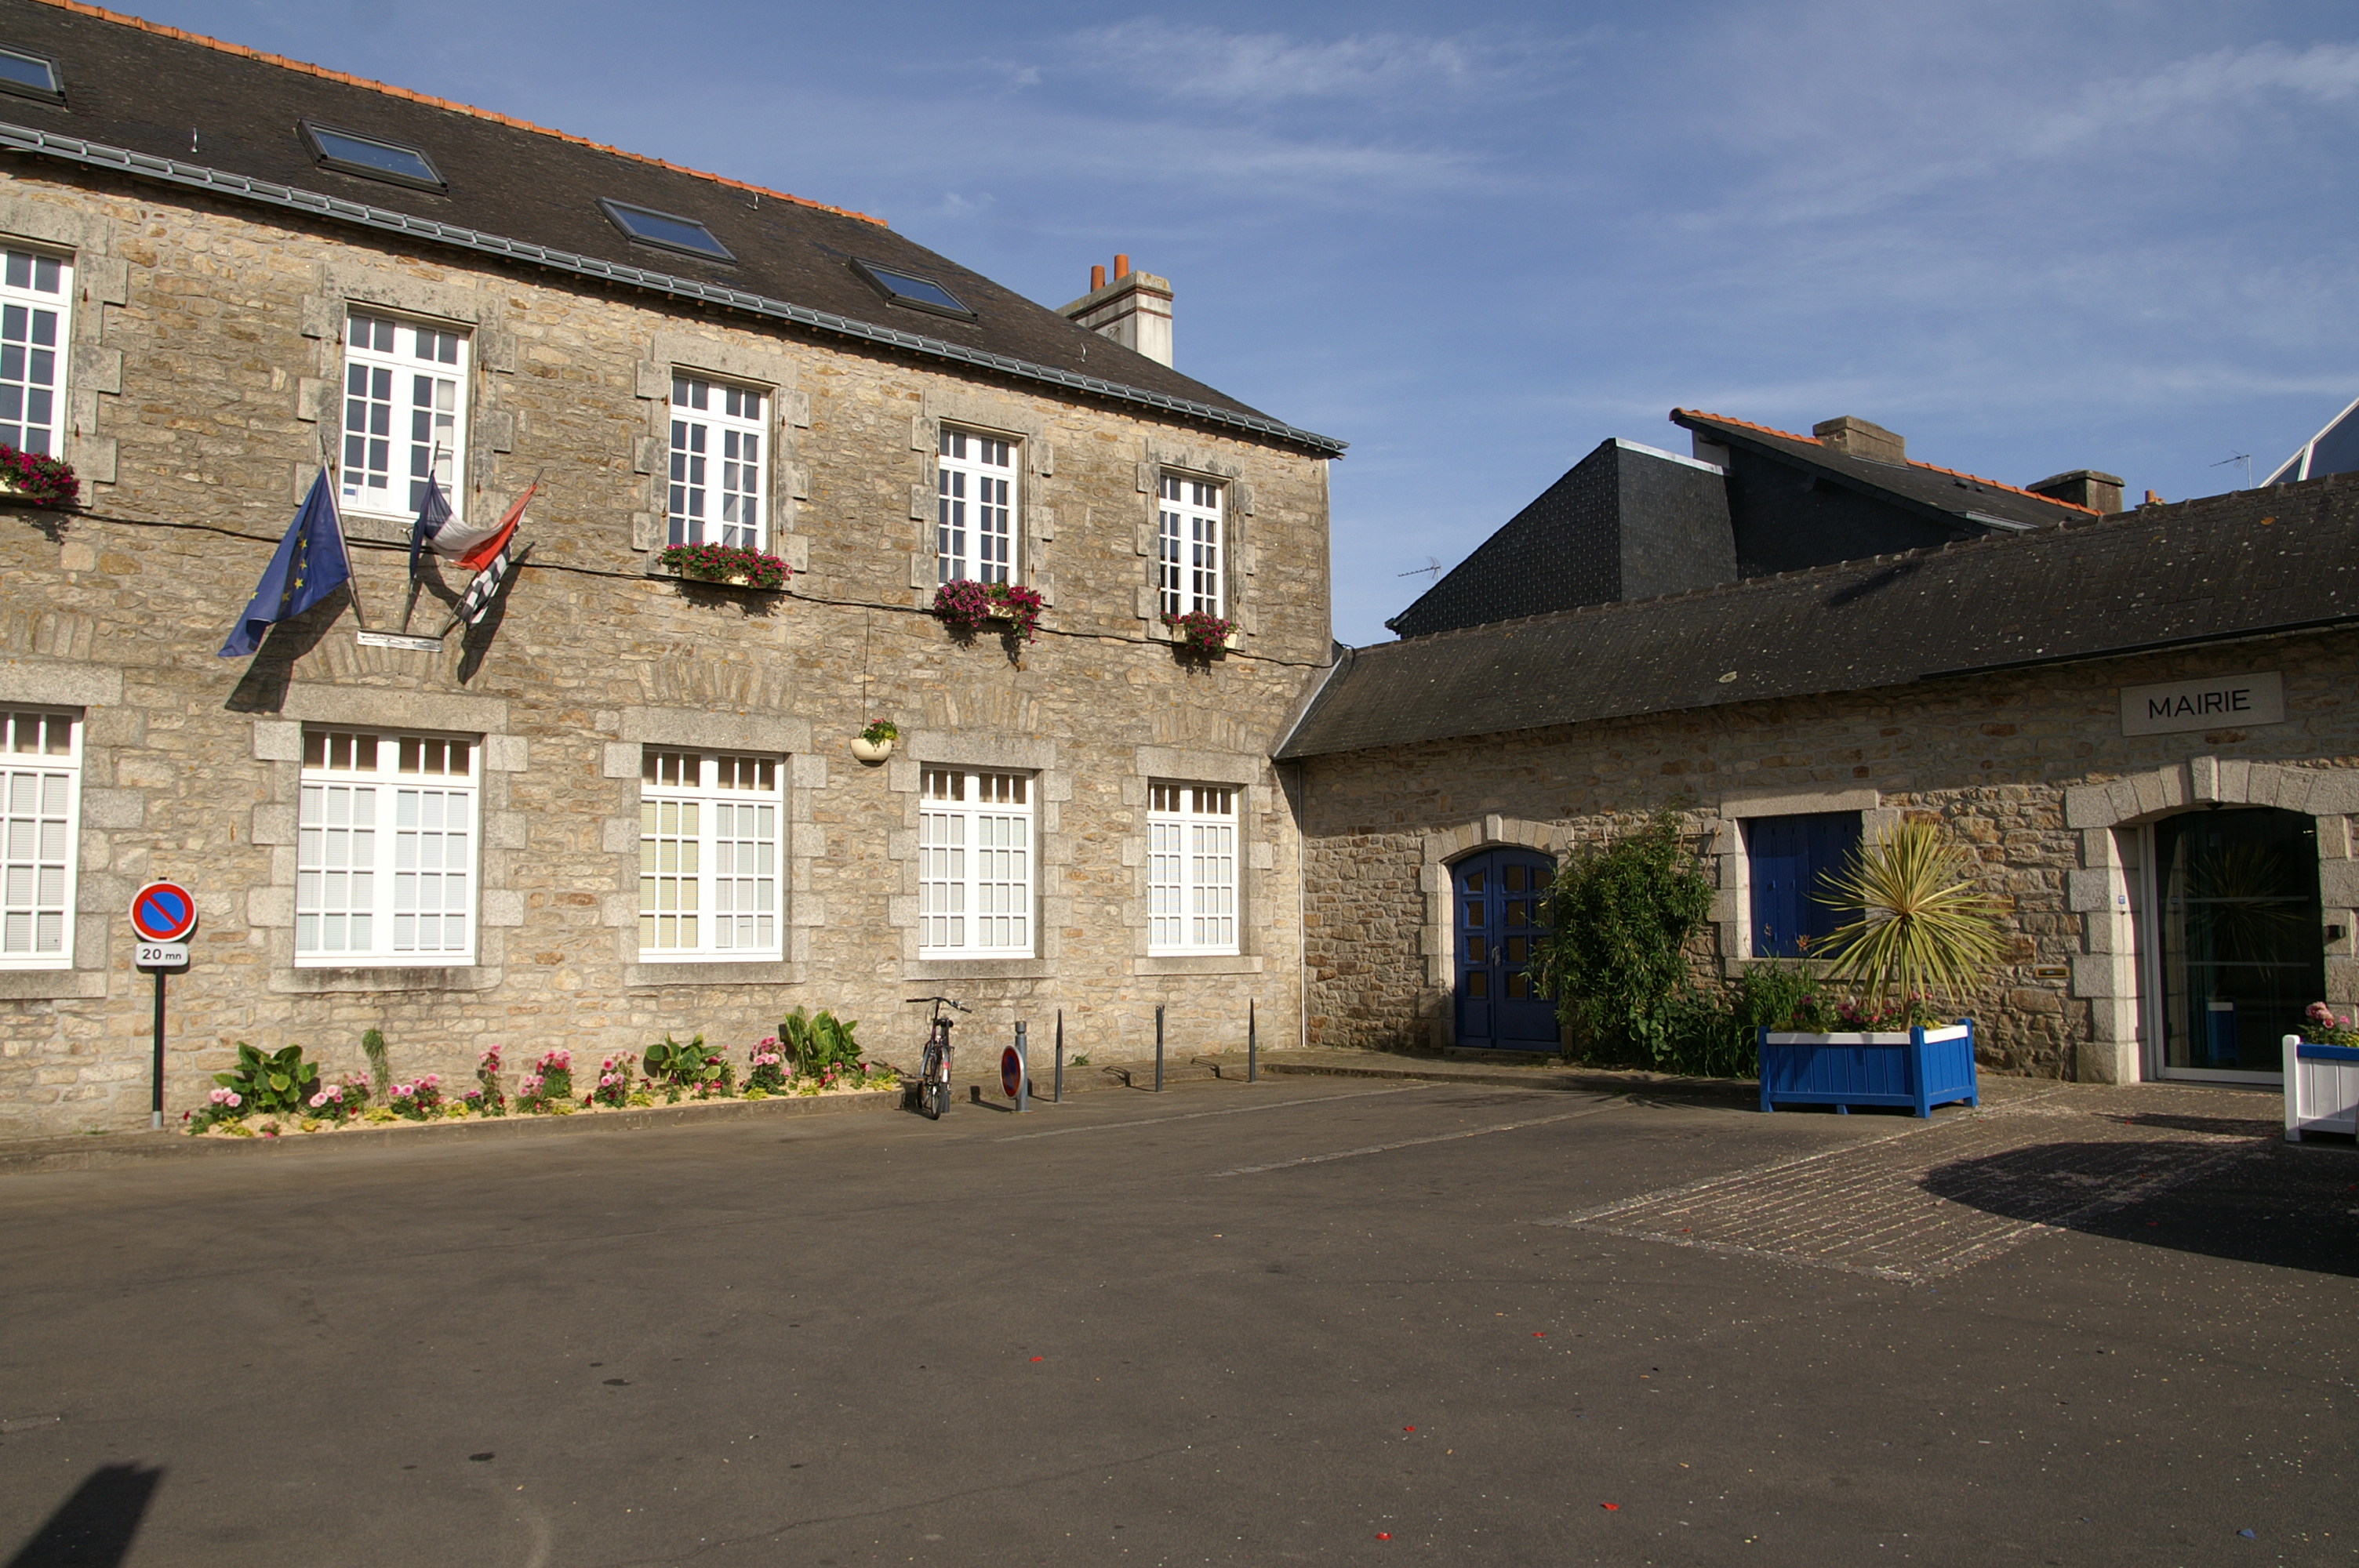
Groix
Groix (French: Île de Groix, Breton: Enez Groe) is an island and a commune in the Morbihan department of the region of Brittany in north-western France. lies a few kilometres off the coast of Lorient. Several ferries a day run from Lorient to Groix...
Groix Wikipedia Page

About Our Data
The data on this page is estimated using a number of publicly available tools and resources. It is provided without warranty, and could contain inaccuracies. Use at your own risk.