Industries
Business Distribution by Industry in Moanda
| Industry Description | Number of Establishments |
|---|---|
| Restaurants | 16 |
| Hotels and motels | 15 |
| Education | 12 |
| Apartments | 12 |
| Shopping | 11 |
| Churches | 8 |
| Bars, pubs and taverns | 7 |
| Department stores | 6 |
| Public administration | 6 |
| Convenience stores | 5 |
| Primary and elementary schools | 5 |
| Playground | 5 |
Moanda Facts
| Area | 8.3 km² |
| Population | 84,439 |
| Male Population | 42,465 (50.3%) |
| Female Population | 41,974 (49.7%) |
| Population change (1975 to 2020) | +1358.1% |
| Population change (2000 to 2020) | +265.1% |
| Median Age | 20.3 years (Male: 20.1, Female: 20.5) |
| Neighborhoods | Cité Cadre Comilog |
| Local Time | |
| Timezone | West Africa Time |
| Lat & Lng | -1.56652, 13.19870 |
Map of Moanda
Interactive Map
Moanda Population
Years 1975 to 2030
| Data | 1975 | 1990 | 2000 | 2015 | 2020 | 2025* | 2030* |
|---|---|---|---|---|---|---|---|
| Population | 5,791 | 15,612 | 23,130 | 55,032 | 84,439 | 105,319 | 126,598 |
| Population Density | 701.9 / km² | 1,892.4 / km² | 2,803.6 / km² | 6,670.5 / km² | 10,235 / km² | 12,765.9 / km² | 15,345.2 / km² |
Moanda Population change from 2000 to 2020
Increase of 265.1% from year 2000 to 2020
| Location | Change since 1975 | Change since 1990 | Change since 2000 |
|---|---|---|---|
| Moanda | +1358.1% | +440.9% | +265.1% |
| Haut-Ogooué Province | — | — | — |
| Gabon | — | — | — |
Moanda Median Age
Median Age: 20.3 years
| Location | Median Age | Median Age (Female) | Median Age (Male) |
|---|---|---|---|
| Moanda | 20.3 yrs | 20.5 yrs | 20.1 yrs |
| Haut-Ogooué Province | 20.3 yrs | 20.5 yrs | 20.1 yrs |
| Gabon | 20.3 yrs | 20.5 yrs | 20.1 yrs |
Moanda Population Density
Population Density: 10,235 / km²
| Location | Population | Area | Density |
|---|---|---|---|
| Moanda | 84,439 | 8.3 km² | 10,235 / km² |
| Haut-Ogooué Province | 394,752 | 34,262.2 km² | 11.5 / km² |
| Gabon | 1.7 million | 262,868.7 km² | 6.4 / km² |
Moanda Historical and Projected Population
Estimated Population from 1930 to 2100
- JRC (European Commission's Joint Research Centre) work on the GHS built-up grid
- CIESIN (Center for International Earth Science Information Network)
- [Link] Klein Goldewijk, K., Beusen, A., Doelman, J., and Stehfest, E.: Anthropogenic land use estimates for the Holocene – HYDE 3.2, Earth Syst. Sci. Data, 9, 927–953, https://doi.org/10.5194/essd-9-927-2017, 2017.
Human Development Index (HDI)
Statistic composite index of life expectancy, education, and per capita income.
Moanda CO2 Emissions
Carbon Dioxide (CO2) Emissions Per Capita in Tonnes Per Year
| Location | CO2 Emissions | CO2 Emissions Per Capita | CO2 Emissions Intensity |
|---|---|---|---|
| Moanda | 172,010 tn | 2.04 tn | 20,849.7 tons/km² |
| Haut-Ogooué Province | 773,264 tn | 1.96 tn | 22.6 tons/km² |
| Gabon | 3,287,773 tn | 1.95 tn | 12.5 tons/km² |
| 2013 CO2 emissions (tonnes/year) | 172,010 tn |
| 2013 CO2 emissions (tonnes/year) per capita | 2.04 tn |
| 2013 CO2 emissions intensity (tonnes/km²/year) | 20,849.7 tons/km² |
Natural Hazards Risk
Relative risk out of 10
| Hazard | Risk Level |
|---|---|
| Earthquake | Low (2) |
* Risk, particularly concerning flood or landslide, may not be for the entire area.
- Dilley, M., R.S. Chen, U. Deichmann, A.L. Lerner-Lam, M. Arnold, J. Agwe, P. Buys, O. Kjekstad, B. Lyon, and G. Yetman. 2005. Natural Disaster Hotspots: A Global Risk Analysis. Washington, D.C.: World Bank. https://doi.org/10.1596/0-8213-5930-4.
- Center for Hazards and Risk Research - CHRR - Columbia University, Center for International Earth Science Information Network - CIESIN - Columbia University. 2005. Global Earthquake Hazard Distribution - Peak Ground Acceleration. Palisades, NY: NASA Socioeconomic Data and Applications Center (SEDAC). https://doi.org/10.7927/H4BZ63ZS.
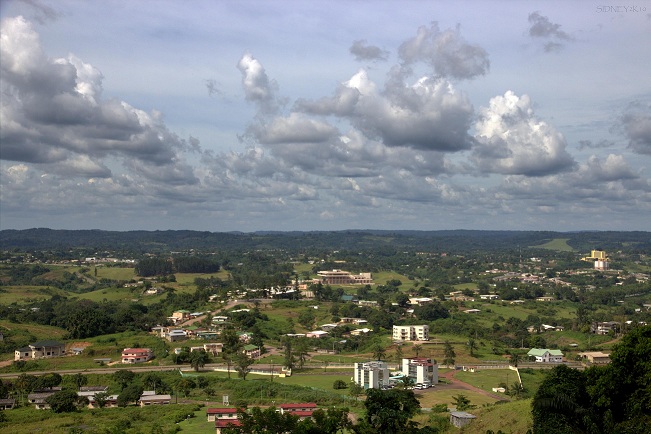
Moanda
Moanda is one of the largest towns in Gabon, lying on the N3 road in Haut Ogooué. It is also one of the most important manganese mining towns in the world, under the auspices of the Compagnie Minière de l'Ogooué (COMILOG), which began mining in 1957...
Moanda Wikipedia Page

About Our Data
The data on this page is estimated using a number of publicly available tools and resources. It is provided without warranty, and could contain inaccuracies. Use at your own risk.