Ntoum Facts
| Area | 27.6 km² |
| Population | 1,163 |
| Population change (1975 to 2020) | +1074.7% |
| Population change (2000 to 2020) | +357.9% |
| GDP per capita (PPP) | $13,623 (2022) |
| Local Time | |
| Timezone | West Africa Time |
| Lat & Lng | 0.39051, 9.76096 |
Map of Ntoum
Interactive Map
Ntoum Population
Years 1975 to 2030
| Data | 1975 | 1990 | 2000 | 2015 | 2020 | 2025* | 2030* |
|---|---|---|---|---|---|---|---|
| Population | 99 | 241 | 254 | 271 | 1,163 | 1,246 | 1,281 |
| Population Density | 3.6 / km² | 8.7 / km² | 9.2 / km² | 9.8 / km² | 42.2 / km² | 45.2 / km² | 46.5 / km² |
Ntoum Population change from 2000 to 2020
Increase of 357.9% from year 2000 to 2020
| Location | Change since 1975 | Change since 1990 | Change since 2000 |
|---|---|---|---|
| Ntoum | +1074.7% | +382.6% | +357.9% |
| Estuaire Province | — | — | — |
| Gabon | — | — | — |
Ntoum Population Density
Population Density: 42.2 / km²
| Location | Population | Area | Density |
|---|---|---|---|
| Ntoum | 1,163 | 27.6 km² | 42.2 / km² |
| Estuaire Province | 647,920 | 19,535.8 km² | 33.2 / km² |
| Gabon | 1.7 million | 262,868.7 km² | 6.4 / km² |
Ntoum Historical and Projected Population
Estimated Population from 1600 to 2100
- JRC (European Commission's Joint Research Centre) work on the GHS built-up grid
- CIESIN (Center for International Earth Science Information Network)
- [Link] Klein Goldewijk, K., Beusen, A., Doelman, J., and Stehfest, E.: Anthropogenic land use estimates for the Holocene – HYDE 3.2, Earth Syst. Sci. Data, 9, 927–953, https://doi.org/10.5194/essd-9-927-2017, 2017.
Human Development Index (HDI)
Statistic composite index of life expectancy, education, and per capita income.
Ntoum Gross Domestic Product (GDP)
GDP per capita, PPP (constant 2017 international $)
| Data | 1990 | 1995 | 2000 | 2005 | 2010 | 2015 | 2020 | 2022 |
|---|---|---|---|---|---|---|---|---|
| GDP per capita | $23,161 | $21,998 | $17,137 | $14,577 | $13,141 | $15,609 | $13,751 | $13,623 |
| Total GDP | $6.5M | $7.1M | $6.7M | $6.3M | $6.5M | $9M | $8.5M | $8.8M |
Ntoum CO2 Emissions
Carbon Dioxide (CO2) Emissions Per Capita in Tonnes Per Year
| Location | CO2 Emissions | CO2 Emissions Per Capita | CO2 Emissions Intensity |
|---|---|---|---|
| Ntoum | 2,303 tn | 1.98 tn | 83.6 tons/km² |
| Estuaire Province | 1,267,072 tn | 1.96 tn | 64.9 tons/km² |
| Gabon | 3,287,773 tn | 1.95 tn | 12.5 tons/km² |
| 2013 CO2 emissions (tonnes/year) | 2,303 tn |
| 2013 CO2 emissions (tonnes/year) per capita | 1.98 tn |
| 2013 CO2 emissions intensity (tonnes/km²/year) | 83.6 tons/km² |
Natural Hazards Risk
Relative risk out of 10
| Hazard | Risk Level |
|---|---|
| Earthquake | Low (2) |
* Risk, particularly concerning flood or landslide, may not be for the entire area.
- Dilley, M., R.S. Chen, U. Deichmann, A.L. Lerner-Lam, M. Arnold, J. Agwe, P. Buys, O. Kjekstad, B. Lyon, and G. Yetman. 2005. Natural Disaster Hotspots: A Global Risk Analysis. Washington, D.C.: World Bank. https://doi.org/10.1596/0-8213-5930-4.
- Center for Hazards and Risk Research - CHRR - Columbia University, Center for International Earth Science Information Network - CIESIN - Columbia University. 2005. Global Earthquake Hazard Distribution - Peak Ground Acceleration. Palisades, NY: NASA Socioeconomic Data and Applications Center (SEDAC). https://doi.org/10.7927/H4BZ63ZS.
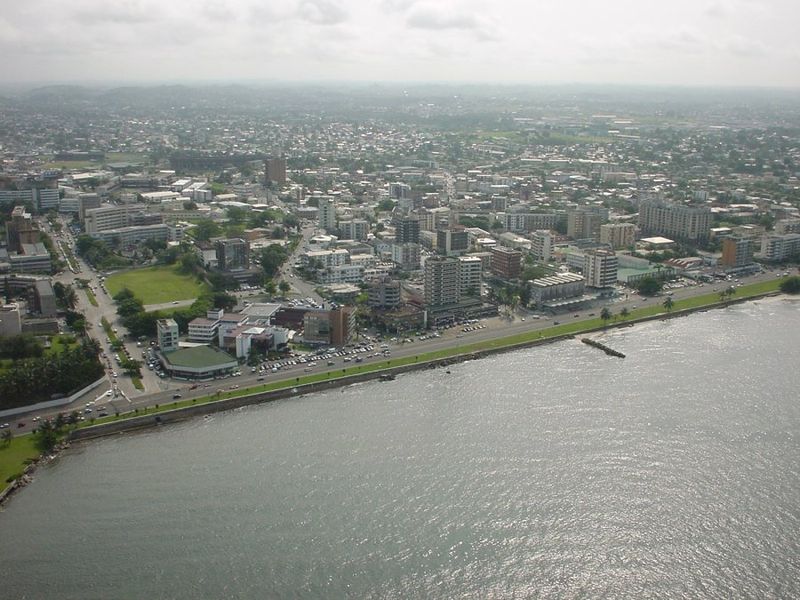
Ntoum
Ntoum or Nkan is a town in Estuaire Province in northwestern Gabon . It is the capital of the Komo-Mondah Department. Nkan lies along the N1 road and L106 road, 39.2 kilometres by road east of Libreville and 12.2 kilometres north of Nzamaligue. In th..
Ntoum Wikipedia Page


About Our Data
The data on this page is estimated using a number of publicly available tools and resources. It is provided without warranty, and could contain inaccuracies. Use at your own risk.