Categories in Caistor
Industries
Business Distribution by Industry in Caistor
| Industry Description | Number of Establishments | Average Google Rating |
|---|---|---|
| Car repair | 5 | 4.7 |
Caistor Facts
| Area | 13.3 km² |
| Population | 2,810 |
| Male Population | 1,371 (48.8%) |
| Female Population | 1,439 (51.2%) |
| Population change (1975 to 2020) | +39.9% |
| Population change (2000 to 2020) | +18.3% |
| Median Age | 47.7 years (Male: 47.5, Female: 47.8) |
| Neighborhoods | Caistor, Nettleton, Nettleton, Caistor |
| Local Time | |
| Timezone | British Summer Time |
| Lat & Lng | 53.49673, -0.31538 |
| Postal Codes | LN7 |
Map of Caistor
Interactive Map
Caistor Population
Years 1975 to 2020
| Data | 1975 | 1990 | 2000 | 2015 | 2020 |
|---|---|---|---|---|---|
| Population | 2,008 | 2,200 | 2,375 | 2,785 | 2,810 |
| Population Density | 151.5 / km² | 166 / km² | 179.2 / km² | 210.2 / km² | 212.1 / km² |
Caistor Population change from 2000 to 2015
Increase of 17.3% from year 2000 to 2015
| Location | Change since 1975 | Change since 1990 | Change since 2000 |
|---|---|---|---|
| Caistor | +38.7% | +26.6% | +17.3% |
| United Kingdom | +15.2% | +13.3% | +9.9% |
Caistor Median Age
Median Age: 47.7 years
| Location | Median Age | Median Age (Female) | Median Age (Male) |
|---|---|---|---|
| Caistor | 47.7 yrs | 47.8 yrs | 47.5 yrs |
| United Kingdom | 39.6 yrs | 40.6 yrs | 38.5 yrs |
Caistor Population Density
Population Density: 212 / km²
| Location | Population | Area | Density |
|---|---|---|---|
| Caistor | 2,810 | 13.3 km² | 212 / km² |
| United Kingdom | 64.5 million | 247,916.6 km² | 260 / km² |
Caistor Historical and Projected Population
Estimated Population from 0 to 2100
- JRC (European Commission's Joint Research Centre) work on the GHS built-up grid
- CIESIN (Center for International Earth Science Information Network)
- [Link] Klein Goldewijk, K., Beusen, A., Doelman, J., and Stehfest, E.: Anthropogenic land use estimates for the Holocene – HYDE 3.2, Earth Syst. Sci. Data, 9, 927–953, https://doi.org/10.5194/essd-9-927-2017, 2017.
Price Distribution
Business distribution by price for Caistor
Human Development Index (HDI)
Statistic composite index of life expectancy, education, and per capita income.
Caistor CO2 Emissions
Carbon Dioxide (CO2) Emissions Per Capita in Tonnes Per Year
| Location | CO2 Emissions | CO2 Emissions Per Capita | CO2 Emissions Intensity |
|---|---|---|---|
| Caistor | 33,134 tn | 11.79 tn | 2,500.7 tons/km² |
| United Kingdom | 735,672,544 tn | 11.4 tn | 2,967.4 tons/km² |
| 2013 CO2 emissions (tonnes/year) | 33,134 tn |
| 2013 CO2 emissions (tonnes/year) per capita | 11.79 tn |
| 2013 CO2 emissions intensity (tonnes/km²/year) | 2,500.7 tons/km² |
Natural Hazards Risk
Relative risk out of 10
| Hazard | Risk Level |
|---|---|
| Flood | High (9) |
| Cyclone | Medium (5) |
* Risk, particularly concerning flood or landslide, may not be for the entire area.
- Dilley, M., R.S. Chen, U. Deichmann, A.L. Lerner-Lam, M. Arnold, J. Agwe, P. Buys, O. Kjekstad, B. Lyon, and G. Yetman. 2005. Natural Disaster Hotspots: A Global Risk Analysis. Washington, D.C.: World Bank. https://doi.org/10.1596/0-8213-5930-4.
- Center for Hazards and Risk Research - CHRR - Columbia University, Center for International Earth Science Information Network - CIESIN - Columbia University, International Bank for Reconstruction and Development - The World Bank, and United Nations Environment Programme Global Resource Information Database Geneva - UNEP/GRID-Geneva. 2005. Global Cyclone Hazard Frequency and Distribution. Palisades, NY: NASA Socioeconomic Data and Applications Center (SEDAC). https://doi.org/10.7927/H4CZ353K.
- Center for Hazards and Risk Research - CHRR - Columbia University, Center for International Earth Science Information Network - CIESIN - Columbia University. 2005. Global Flood Hazard Frequency and Distribution. Palisades, NY: NASA Socioeconomic Data and Applications Center (SEDAC). https://doi.org/10.7927/H4668B3D.
Recent Nearby Earthquakes
Magnitude 3.0 and greater
| Date▼ | Time↕ | Magnitude↕ | Distance↕ | Depth↕ | Location↕ | Link |
|---|---|---|---|---|---|---|
| 6/9/18 | 10:14 PM | 4.1 | 41.3 km | 10,000 m | 7km NNE of Withernsea, United Kingdom | usgs.gov |
| 1/28/15 | 10:25 PM | 3.8 | 89.8 km | 3,000 m | 1km N of Ashwell, United Kingdom | usgs.gov |
| 4/18/14 | 6:50 AM | 3.5 | 90.6 km | 2,000 m | 1km NW of Ashwell, United Kingdom | usgs.gov |
| 4/11/09 | 11:39 AM | 3 | 21.6 km | 15,300 m | England, United Kingdom | usgs.gov |
| 4/5/08 | 1:57 PM | 3.1 | 15.7 km | 19,200 m | England, United Kingdom | usgs.gov |
| 2/27/08 | 12:56 AM | 4.8 | 10.5 km | 18,400 m | England, United Kingdom | usgs.gov |
| 12/30/06 | 9:15 AM | 3.6 | 89 km | 11,000 m | England, United Kingdom | usgs.gov |
| 7/5/04 | 10:17 PM | 3 | 52.4 km | 9,500 m | England, United Kingdom | usgs.gov |
| 8/19/03 | 7:46 PM | 3.2 | 46.3 km | 13,200 m | England, United Kingdom | usgs.gov |
| 10/28/01 | 4:25 PM | 4.2 | 80.9 km | 11,600 m | England, United Kingdom | usgs.gov |
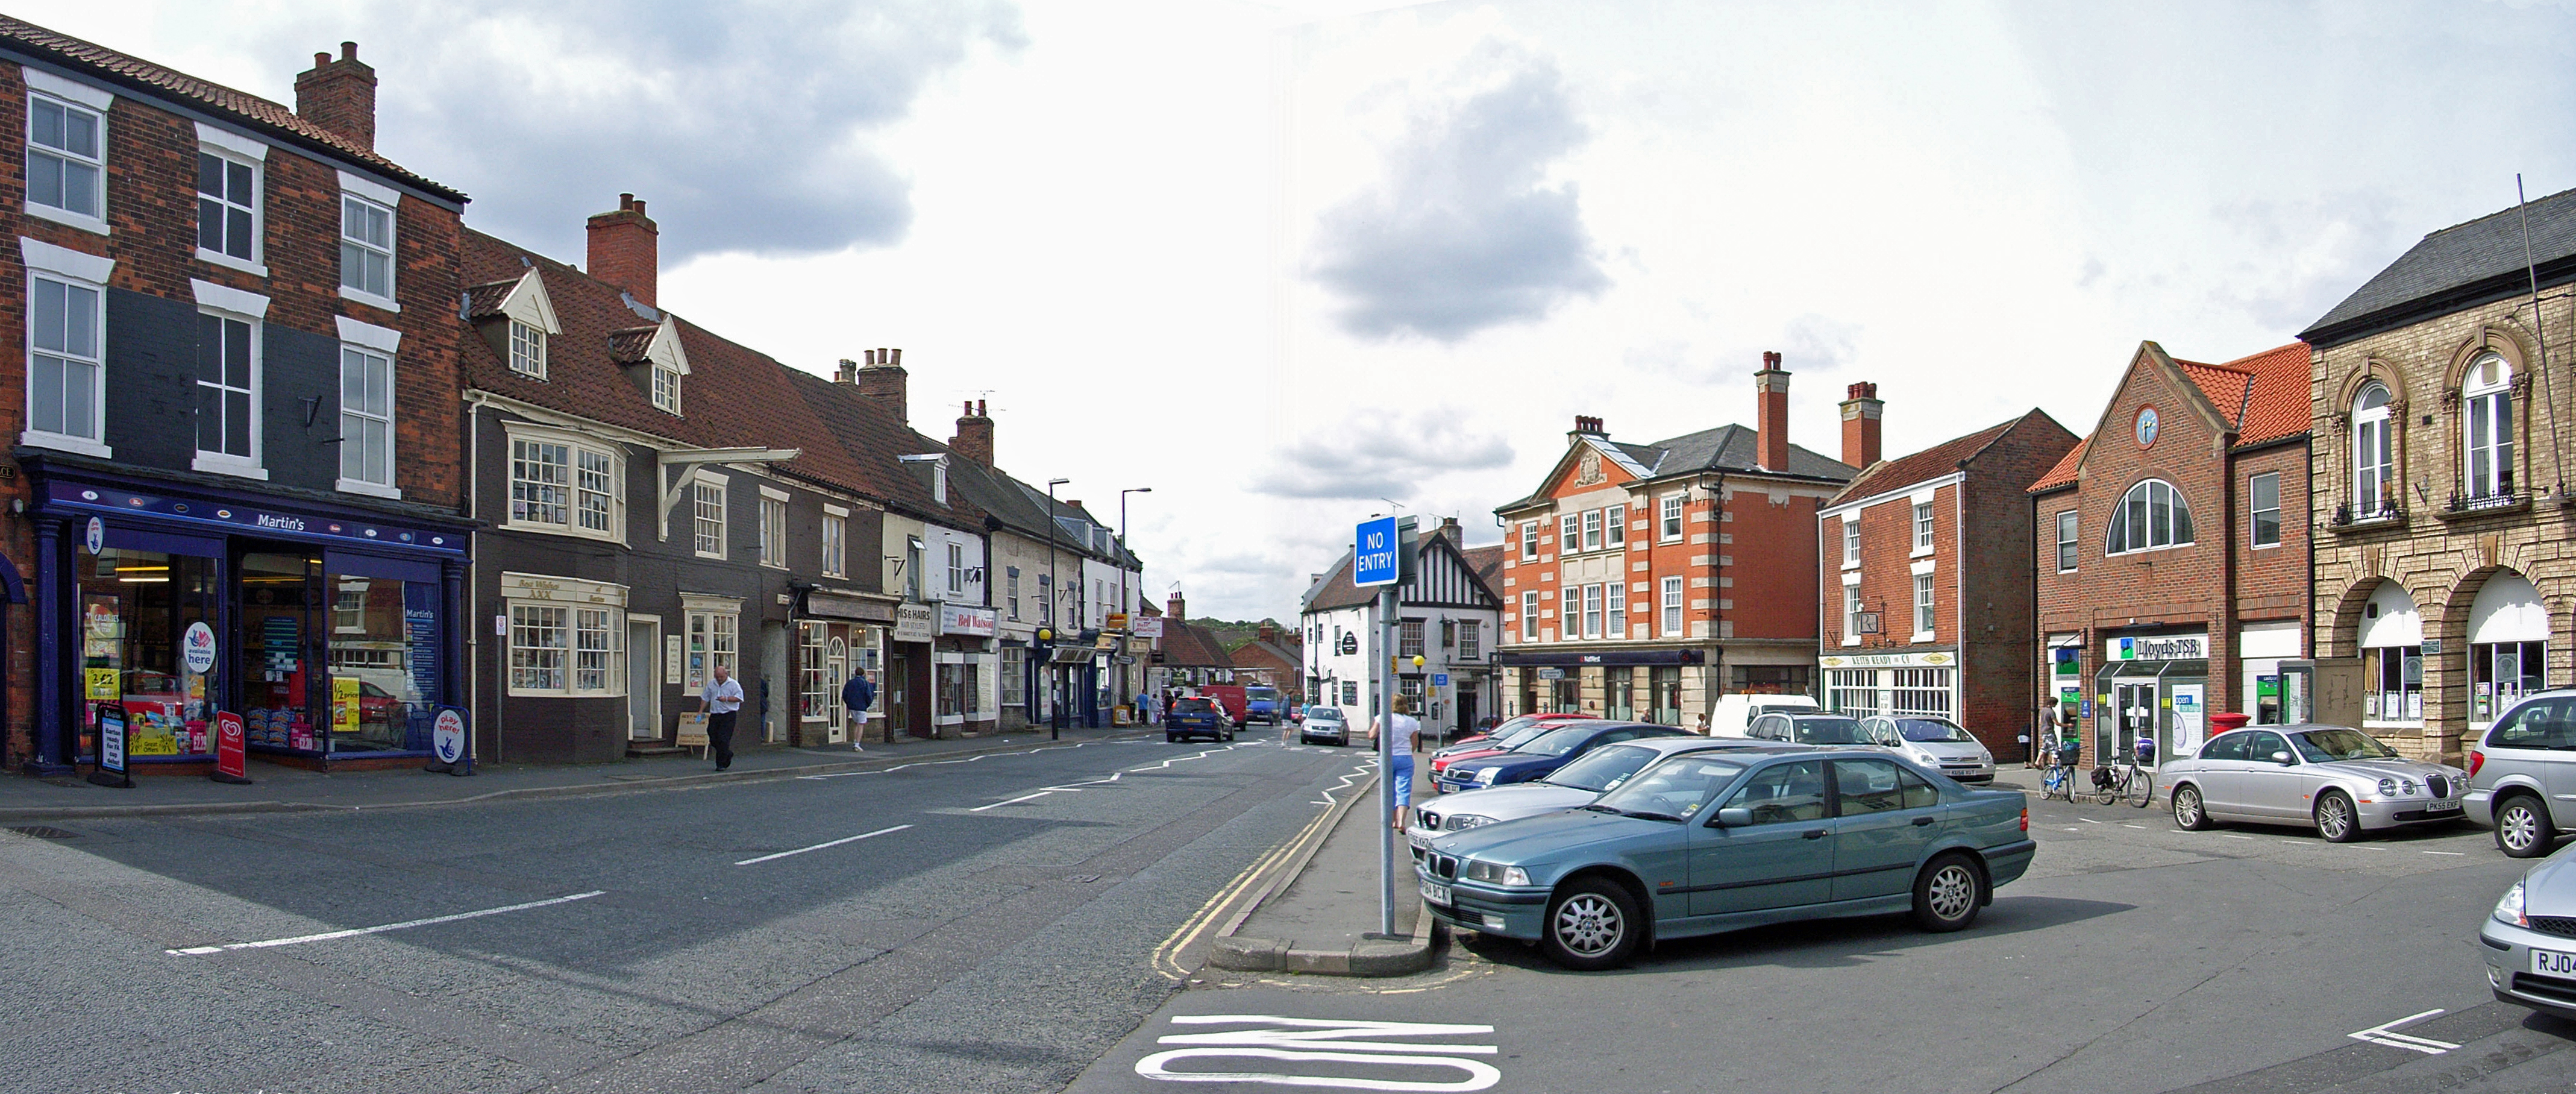
Caistor
is a town and civil parish situated in the West Lindsey district of Lincolnshire, England. As its name implies, it was originally a Roman castrum or fortress. It lies at the north-west edge of the Lincolnshire Wolds, on the Viking Way, and just off..
Caistor Wikipedia Page


About Our Data
The data on this page is estimated using a number of publicly available tools and resources. It is provided without warranty, and could contain inaccuracies. Use at your own risk.