Categories in Christleton
Christleton Facts
| Area | 15.4 km² |
| Population | 9,325 |
| Male Population | 4,486 (48.1%) |
| Female Population | 4,839 (51.9%) |
| Population change (1975 to 2020) | -1.5% |
| Population change (2000 to 2020) | +5.7% |
| Median Age | 45.3 years (Male: 44.3, Female: 46.2) |
| Neighborhoods | Hawarden |
| Local Time | |
| Timezone | British Summer Time |
| Lat & Lng | 53.18509, -2.83789 |
| Postal Codes | CH1, CH3 |
Map of Christleton
Interactive Map
Christleton Population
Years 1975 to 2020
| Data | 1975 | 1990 | 2000 | 2015 | 2020 |
|---|---|---|---|---|---|
| Population | 9,463 | 8,984 | 8,824 | 8,977 | 9,325 |
| Population Density | 613 / km² | 582 / km² | 571.6 / km² | 581.5 / km² | 604 / km² |
Christleton Population change from 2000 to 2015
Increase of 1.7% from year 2000 to 2015
| Location | Change since 1975 | Change since 1990 | Change since 2000 |
|---|---|---|---|
| Christleton | -5.1% | -0.1% | +1.7% |
| United Kingdom | +15.2% | +13.3% | +9.9% |
Christleton Median Age
Median Age: 45.3 years
| Location | Median Age | Median Age (Female) | Median Age (Male) |
|---|---|---|---|
| Christleton | 45.3 yrs | 46.2 yrs | 44.3 yrs |
| United Kingdom | 39.6 yrs | 40.6 yrs | 38.5 yrs |
Christleton Population Density
Population Density: 604 / km²
| Location | Population | Area | Density |
|---|---|---|---|
| Christleton | 9,325 | 15.4 km² | 604 / km² |
| United Kingdom | 64.5 million | 247,916.6 km² | 260 / km² |
Christleton Historical and Projected Population
Estimated Population from 1100 to 2100
- JRC (European Commission's Joint Research Centre) work on the GHS built-up grid
- CIESIN (Center for International Earth Science Information Network)
- [Link] Klein Goldewijk, K., Beusen, A., Doelman, J., and Stehfest, E.: Anthropogenic land use estimates for the Holocene – HYDE 3.2, Earth Syst. Sci. Data, 9, 927–953, https://doi.org/10.5194/essd-9-927-2017, 2017.
Area Codes
Percentage Area Codes used by businesses in Christleton
Postal Codes
Percentage of businesses by Postal Codes in Christleton
Human Development Index (HDI)
Statistic composite index of life expectancy, education, and per capita income.
United Kingdom CO2 Emissions
Carbon Dioxide (CO2) Emissions Per Capita in Tonnes Per Year
| Location | CO2 Emissions | CO2 Emissions Per Capita | CO2 Emissions Intensity |
|---|---|---|---|
| United Kingdom | 735,672,544 tn | 11.4 tn | 2,967.4 tons/km² |
| 2013 CO2 emissions (tonnes/year) | 735,672,544 tn |
| 2013 CO2 emissions (tonnes/year) per capita | 11.4 tn |
| 2013 CO2 emissions intensity (tonnes/km²/year) | 2,967.4 tons/km² |
Natural Hazards Risk
Relative risk out of 10
| Hazard | Risk Level |
|---|---|
| Flood | High (9) |
| Earthquake | Low (2) |
* Risk, particularly concerning flood or landslide, may not be for the entire area.
- Dilley, M., R.S. Chen, U. Deichmann, A.L. Lerner-Lam, M. Arnold, J. Agwe, P. Buys, O. Kjekstad, B. Lyon, and G. Yetman. 2005. Natural Disaster Hotspots: A Global Risk Analysis. Washington, D.C.: World Bank. https://doi.org/10.1596/0-8213-5930-4.
- Center for Hazards and Risk Research - CHRR - Columbia University, Center for International Earth Science Information Network - CIESIN - Columbia University. 2005. Global Flood Hazard Frequency and Distribution. Palisades, NY: NASA Socioeconomic Data and Applications Center (SEDAC). https://doi.org/10.7927/H4668B3D.
- Center for Hazards and Risk Research - CHRR - Columbia University, Center for International Earth Science Information Network - CIESIN - Columbia University. 2005. Global Earthquake Hazard Distribution - Peak Ground Acceleration. Palisades, NY: NASA Socioeconomic Data and Applications Center (SEDAC). https://doi.org/10.7927/H4BZ63ZS.
Recent Nearby Earthquakes
Magnitude 3.0 and greater
| Date▼ | Time↕ | Magnitude↕ | Distance↕ | Depth↕ | Location↕ | Link |
|---|---|---|---|---|---|---|
| 8/25/13 | 9:58 AM | 3.2 | 86.6 km | 8,000 m | 24km WNW of Blackpool, United Kingdom | usgs.gov |
| 11/30/07 | 10:05 PM | 3.3 | 46.1 km | 12,000 m | Wales, United Kingdom | usgs.gov |
| 2/14/05 | 6:44 PM | 3.8 | 68.4 km | 4,900 m | United Kingdom | usgs.gov |
| 2/29/04 | 5:08 AM | 3.4 | 70.1 km | 12,400 m | England, United Kingdom | usgs.gov |
| 10/29/02 | 4:42 AM | 3.1 | 53.9 km | 5,000 m | England, United Kingdom | usgs.gov |
| 10/24/02 | 8:24 AM | 3.8 | 55.1 km | 3,700 m | England, United Kingdom | usgs.gov |
| 10/23/02 | 1:53 AM | 3.3 | 55.8 km | 5,000 m | England, United Kingdom | usgs.gov |
| 10/22/02 | 12:28 PM | 3.5 | 56.1 km | 4,200 m | England, United Kingdom | usgs.gov |
| 10/21/02 | 11:42 AM | 4.3 | 52.6 km | 5,000 m | England, United Kingdom | usgs.gov |
| 10/21/02 | 7:45 AM | 3.7 | 64.5 km | 5,000 m | England, United Kingdom | usgs.gov |
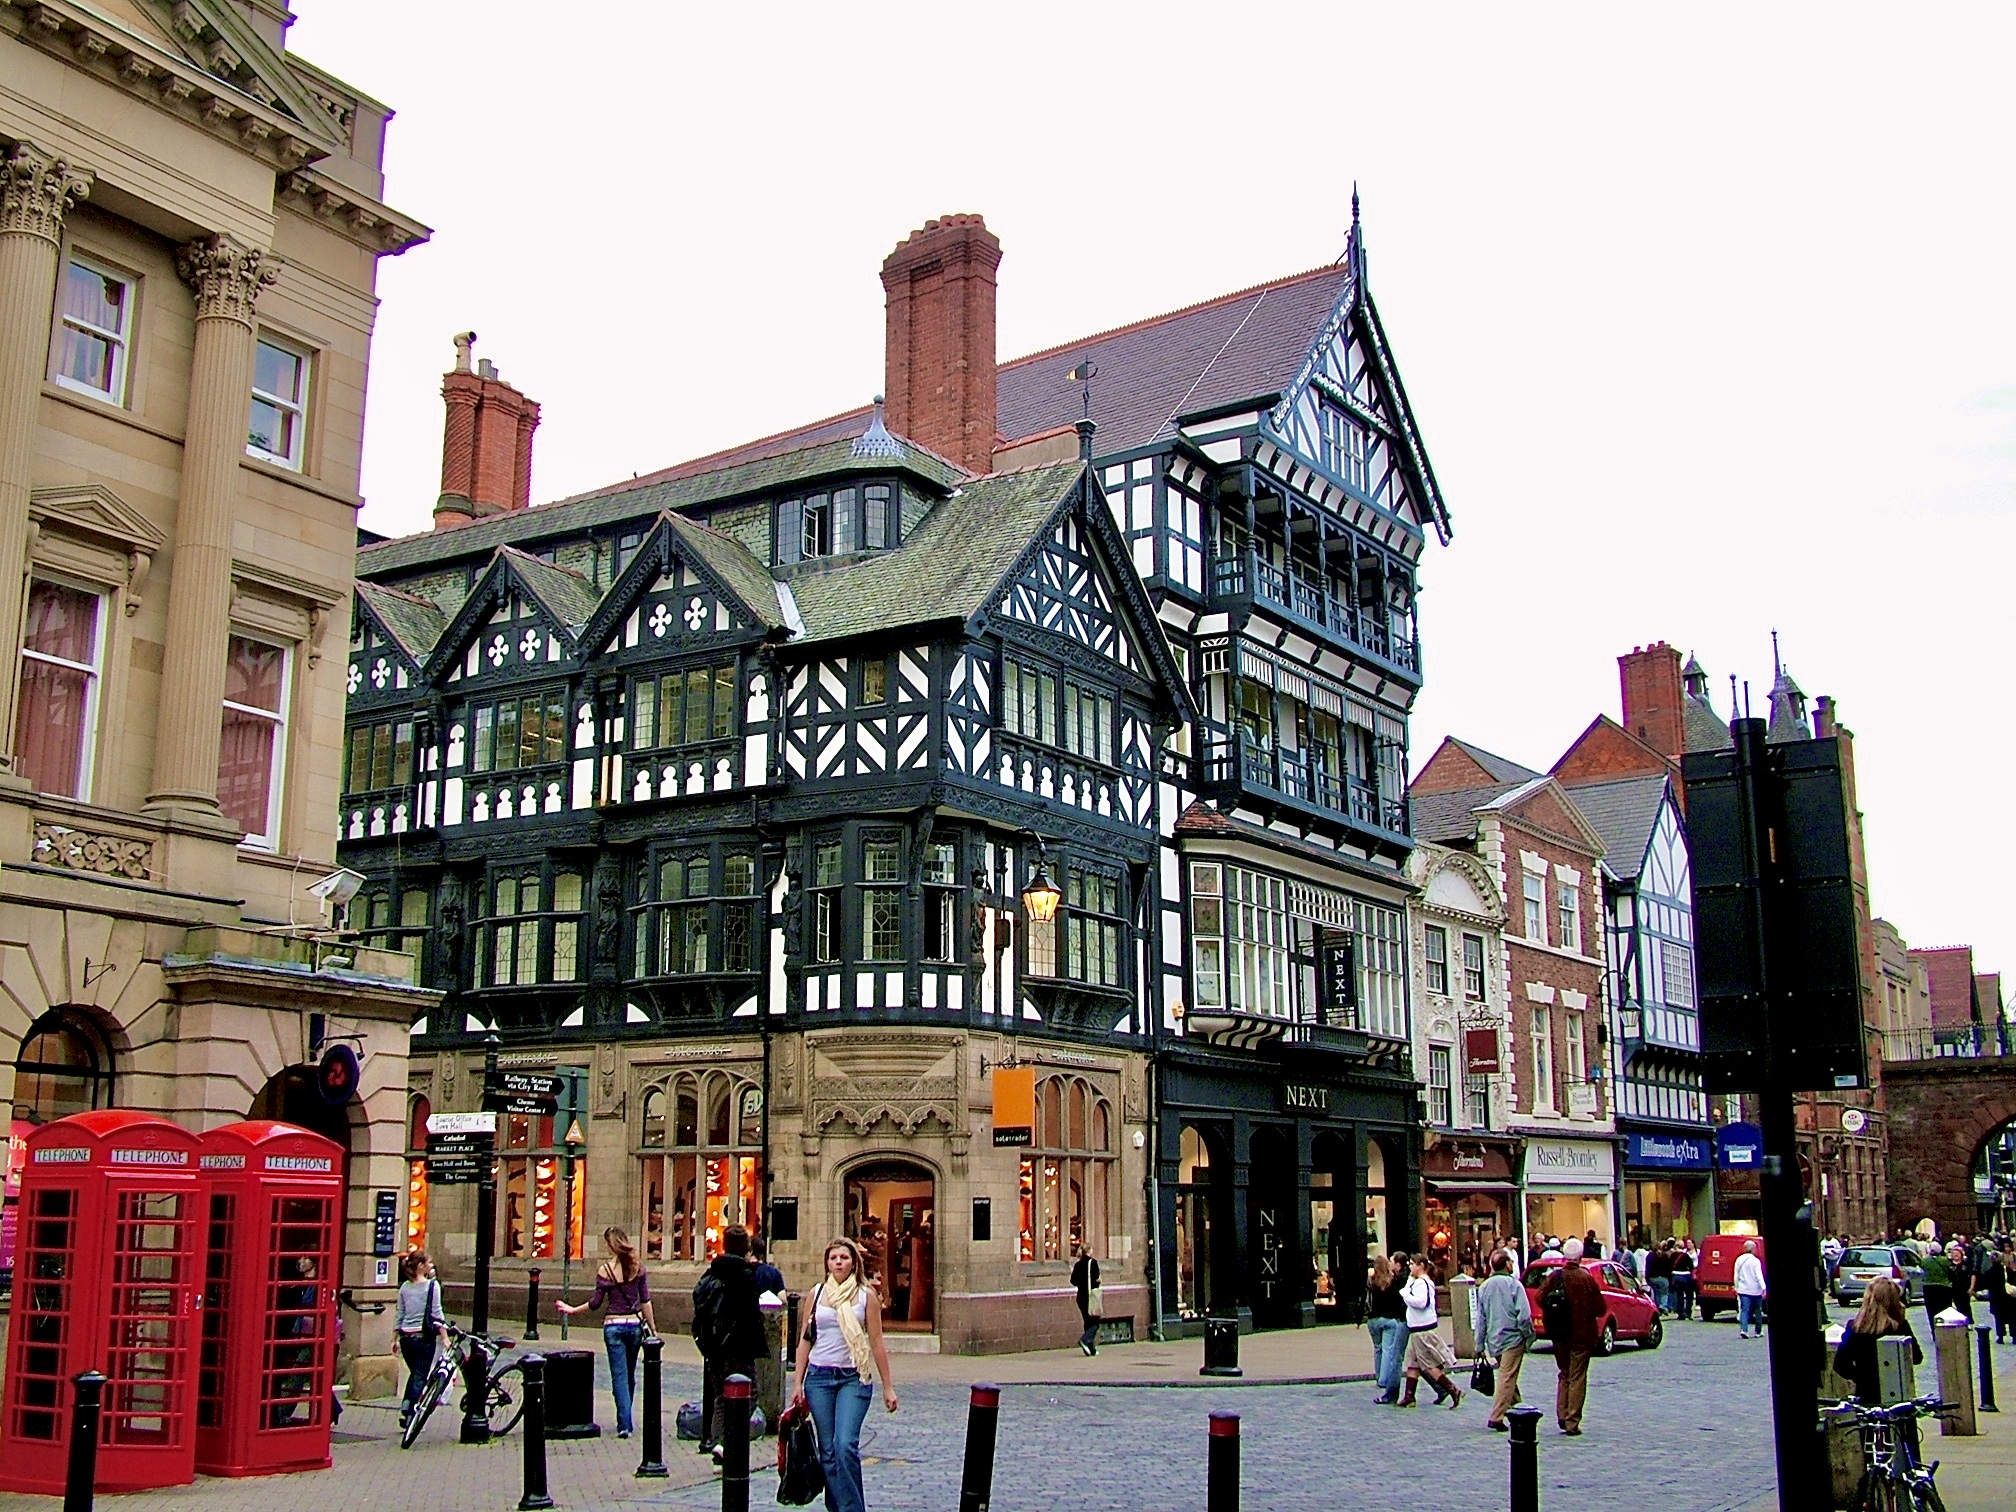
Christleton
is a village and civil parish on the outskirts of Chester in the unitary authority of Cheshire West and Chester and the ceremonial county of Cheshire, England. The 2001 Census recorded a population for the entire civil parish of 2,112. The Shropshi..
Christleton Wikipedia Page
About Our Data
The data on this page is estimated using a number of publicly available tools and resources. It is provided without warranty, and could contain inaccuracies. Use at your own risk.