Categories in Clun
Industries
Business Distribution by Industry in Clun
| Industry Description | Number of Establishments |
|---|---|
| Tractors and farm equipment | 5 |
| Grocery stores and supermarkets | 5 |
Clun Facts
| Area | 60.4 km² |
| Population | 1,209 |
| Male Population | 603 (49.9%) |
| Female Population | 606 (50.1%) |
| Population change (1975 to 2020) | +18.8% |
| Population change (2000 to 2020) | +10.3% |
| Median Age | 53 years (Male: 52.6, Female: 53.3) |
| Local Time | |
| Timezone | British Summer Time |
| Lat & Lng | 52.42141, -3.02753 |
| Postal Codes | LD7, SY7, SY9 |
Map of Clun
Interactive Map
Clun Population
Years 1975 to 2020
| Data | 1975 | 1990 | 2000 | 2015 | 2020 |
|---|---|---|---|---|---|
| Population | 1,018 | 1,054 | 1,096 | 1,215 | 1,209 |
| Population Density | 16.8 / km² | 17.4 / km² | 18.1 / km² | 20.1 / km² | 20 / km² |
Clun Population change from 2000 to 2015
Increase of 10.9% from year 2000 to 2015
| Location | Change since 1975 | Change since 1990 | Change since 2000 |
|---|---|---|---|
| Clun | +19.4% | +15.3% | +10.9% |
| United Kingdom | +15.2% | +13.3% | +9.9% |
Clun Median Age
Median Age: 53 years
| Location | Median Age | Median Age (Female) | Median Age (Male) |
|---|---|---|---|
| Clun | 53 yrs | 53.3 yrs | 52.6 yrs |
| United Kingdom | 39.6 yrs | 40.6 yrs | 38.5 yrs |
Clun Population Density
Population Density: 20 / km²
| Location | Population | Area | Density |
|---|---|---|---|
| Clun | 1,209 | 60.4 km² | 20 / km² |
| United Kingdom | 64.5 million | 247,916.6 km² | 260 / km² |
Clun Historical and Projected Population
Estimated Population from 0 to 2100
- JRC (European Commission's Joint Research Centre) work on the GHS built-up grid
- CIESIN (Center for International Earth Science Information Network)
- [Link] Klein Goldewijk, K., Beusen, A., Doelman, J., and Stehfest, E.: Anthropogenic land use estimates for the Holocene – HYDE 3.2, Earth Syst. Sci. Data, 9, 927–953, https://doi.org/10.5194/essd-9-927-2017, 2017.
Human Development Index (HDI)
Statistic composite index of life expectancy, education, and per capita income.
United Kingdom CO2 Emissions
Carbon Dioxide (CO2) Emissions Per Capita in Tonnes Per Year
| Location | CO2 Emissions | CO2 Emissions Per Capita | CO2 Emissions Intensity |
|---|---|---|---|
| United Kingdom | 735,672,544 tn | 11.4 tn | 2,967.4 tons/km² |
| 2013 CO2 emissions (tonnes/year) | 735,672,544 tn |
| 2013 CO2 emissions (tonnes/year) per capita | 11.4 tn |
| 2013 CO2 emissions intensity (tonnes/km²/year) | 2,967.4 tons/km² |
Natural Hazards Risk
Relative risk out of 10
| Hazard | Risk Level |
|---|---|
| Flood | High (10) |
| Earthquake | Low (2) |
* Risk, particularly concerning flood or landslide, may not be for the entire area.
- Dilley, M., R.S. Chen, U. Deichmann, A.L. Lerner-Lam, M. Arnold, J. Agwe, P. Buys, O. Kjekstad, B. Lyon, and G. Yetman. 2005. Natural Disaster Hotspots: A Global Risk Analysis. Washington, D.C.: World Bank. https://doi.org/10.1596/0-8213-5930-4.
- Center for Hazards and Risk Research - CHRR - Columbia University, Center for International Earth Science Information Network - CIESIN - Columbia University. 2005. Global Flood Hazard Frequency and Distribution. Palisades, NY: NASA Socioeconomic Data and Applications Center (SEDAC). https://doi.org/10.7927/H4668B3D.
- Center for Hazards and Risk Research - CHRR - Columbia University, Center for International Earth Science Information Network - CIESIN - Columbia University. 2005. Global Earthquake Hazard Distribution - Peak Ground Acceleration. Palisades, NY: NASA Socioeconomic Data and Applications Center (SEDAC). https://doi.org/10.7927/H4BZ63ZS.
Recent Nearby Earthquakes
Magnitude 3.0 and greater
| Date▼ | Time↕ | Magnitude↕ | Distance↕ | Depth↕ | Location↕ | Link |
|---|---|---|---|---|---|---|
| 2/17/18 | 2:31 PM | 4.3 | 96.2 km | 11,550 m | 5km NE of Clydach, United Kingdom | usgs.gov |
| 10/26/08 | 6:06 PM | 3.9 | 42.2 km | 9,300 m | England, United Kingdom | usgs.gov |
| 11/30/07 | 10:05 PM | 3.3 | 52.3 km | 12,000 m | Wales, United Kingdom | usgs.gov |
| 9/23/02 | 3:32 AM | 3.2 | 61.6 km | 9,300 m | England, United Kingdom | usgs.gov |
| 9/22/02 | 11:53 PM | 4.8 | 60.6 km | 9,400 m | England, United Kingdom | usgs.gov |
| 6/20/02 | 5:26 PM | 3.4 | 95.1 km | 14,300 m | Wales-England region, United Kingdom | usgs.gov |
| 2/12/02 | 7:13 PM | 3.5 | 81.8 km | 8,300 m | Wales-England region, United Kingdom | usgs.gov |
| 1/28/02 | 12:30 AM | 3 | 88.4 km | 10,000 m | Wales-England region, United Kingdom | usgs.gov |
| 10/10/01 | 2:52 AM | 3.5 | 97.5 km | 10,000 m | Wales-England region, United Kingdom | usgs.gov |
| 9/23/00 | 4:23 AM | 4 | 97.9 km | 13,100 m | England, United Kingdom | usgs.gov |
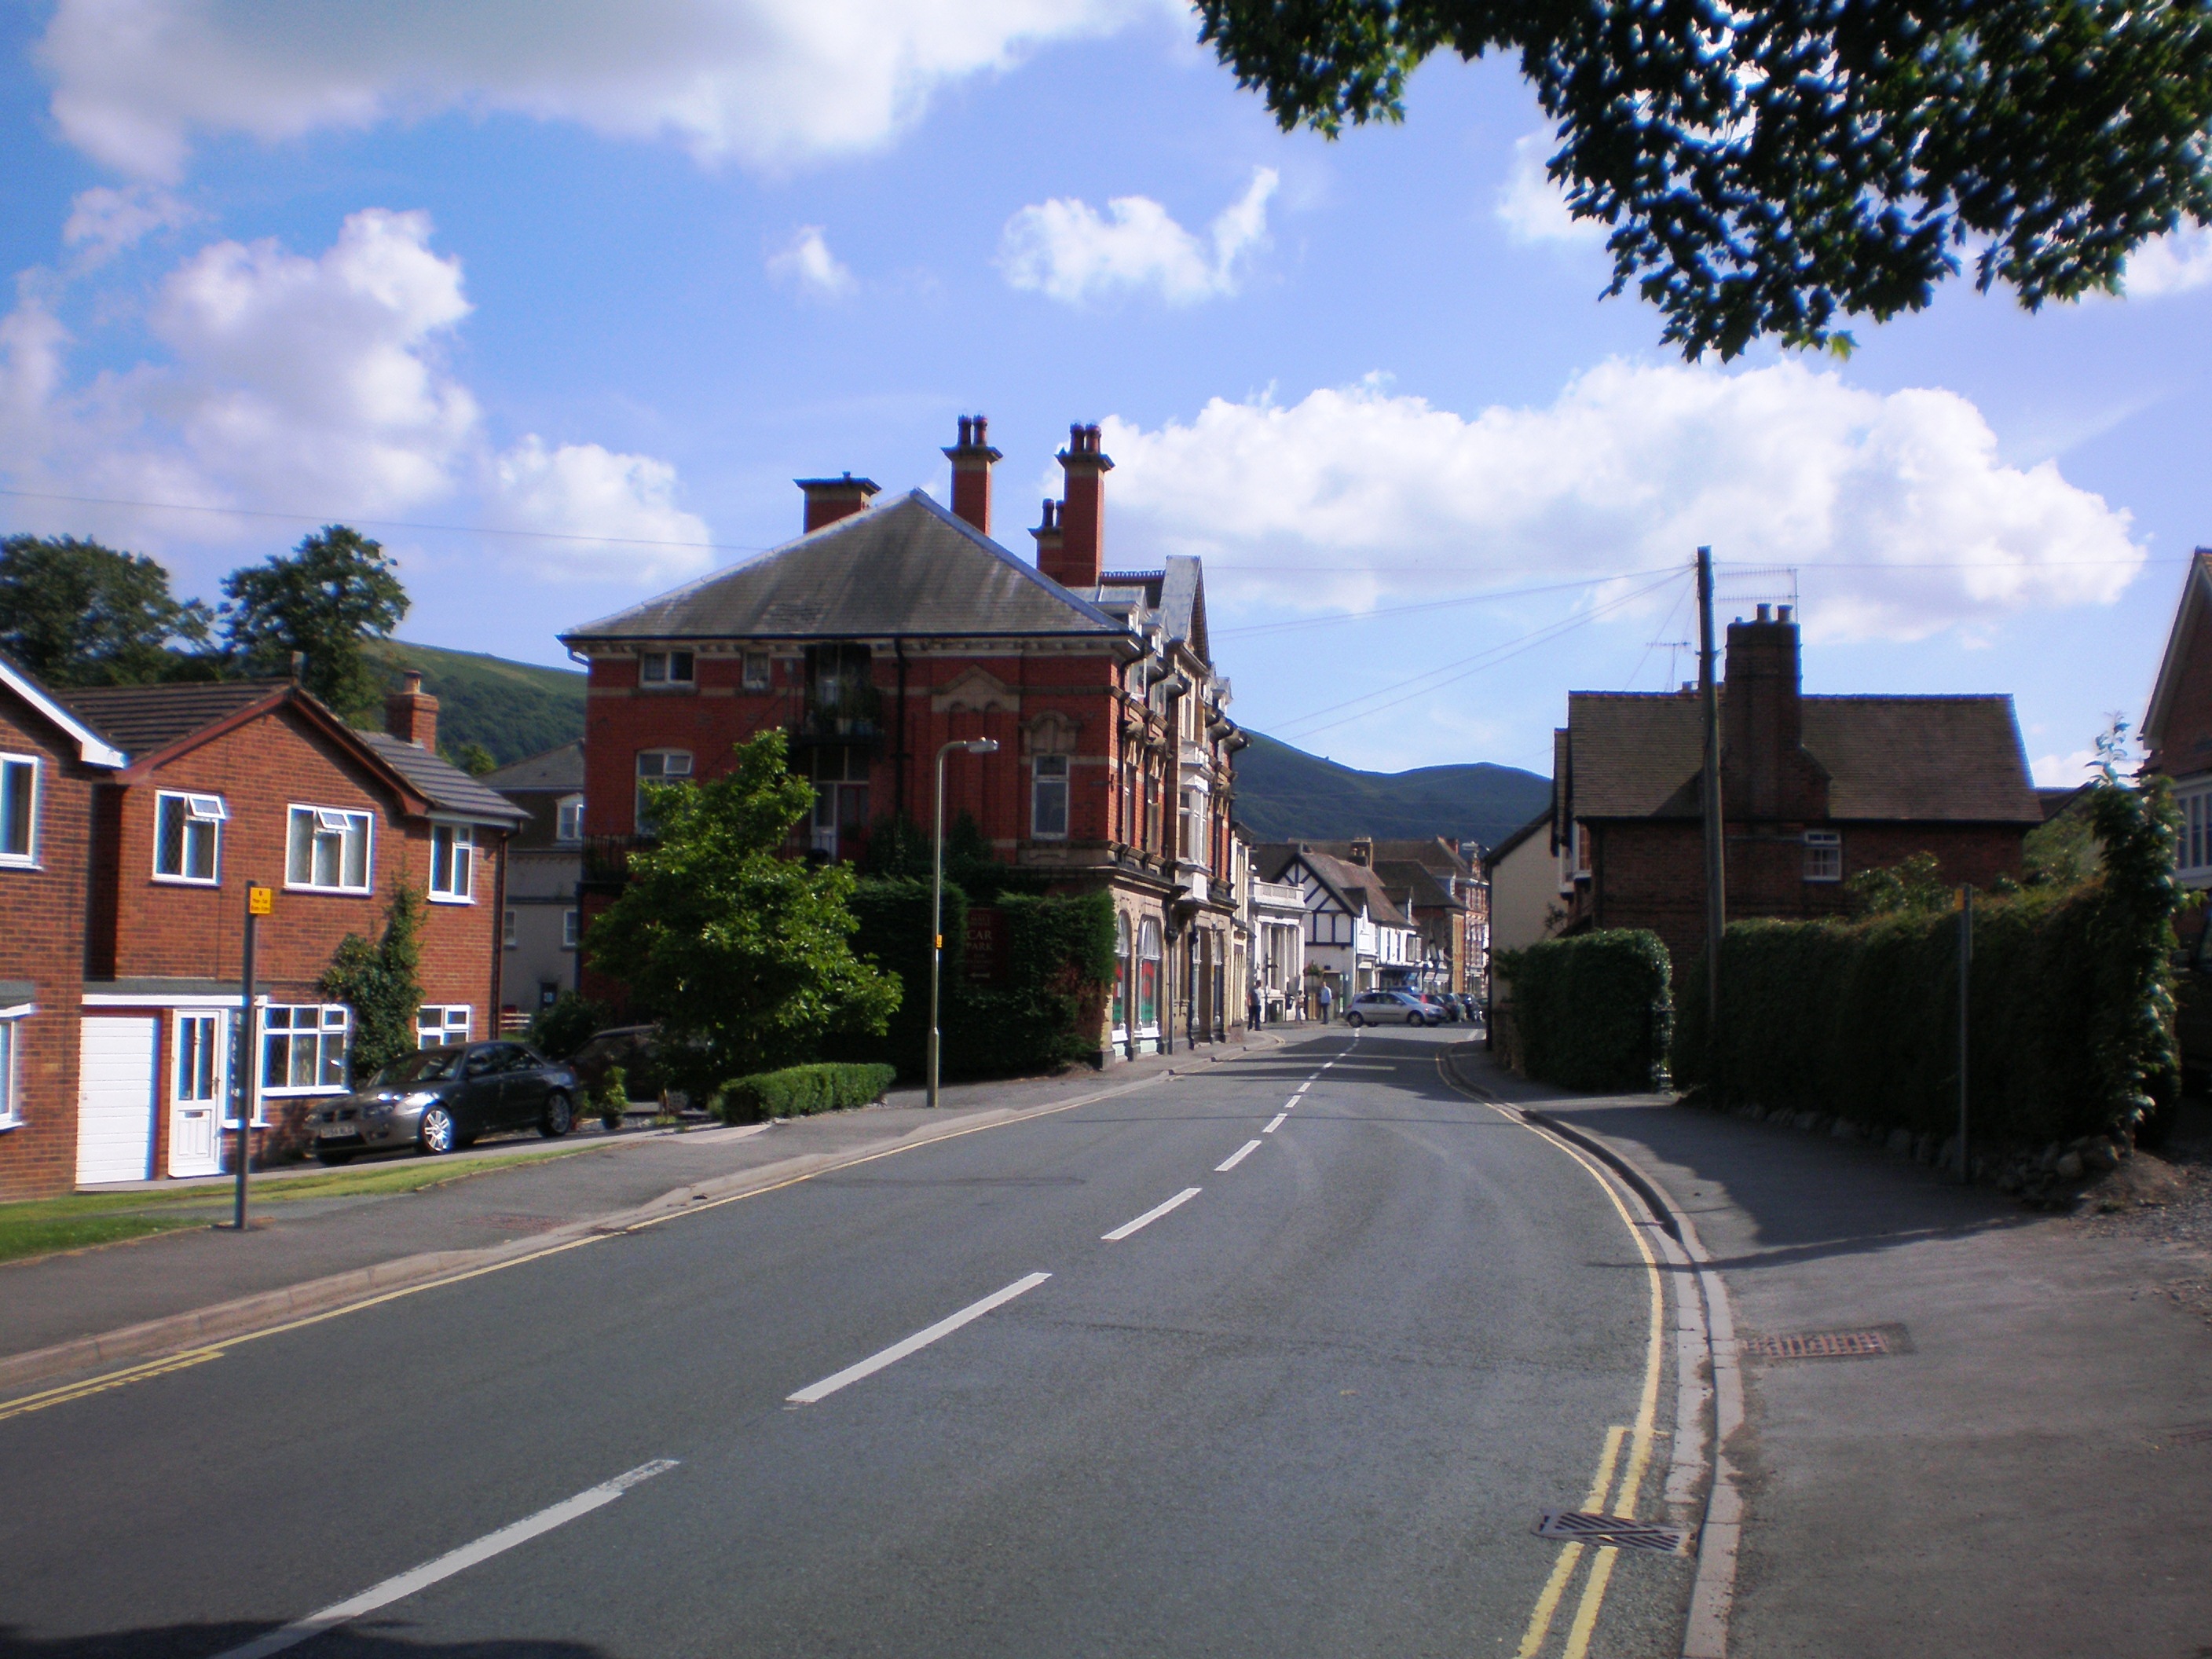
Clun
/ˈklʌn/ is a small town in south Shropshire, England. The town is located entirely in the Shropshire Hills Area of Outstanding Natural Beauty. The 2011 census recorded 680 people living in the town. Research by the Campaign for the Protection of Ru..
Clun Wikipedia Page

About Our Data
The data on this page is estimated using a number of publicly available tools and resources. It is provided without warranty, and could contain inaccuracies. Use at your own risk.