Categories in Halstead
Industries
Business Distribution by Industry in Halstead
| Industry Description | Number of Establishments | Average Age of Business | Average Google Rating |
|---|---|---|---|
| Shopping | 211 | 28 years | 4.4 |
| Shopping other | 74 | 31 years | 4.2 |
| Grocery stores and supermarkets | 63 | — | 4.3 |
| Car repair | 55 | 22 years | 4.4 |
| General contractors | 54 | 25 years | 4.2 |
| Health and medical | 52 | — | 3.2 |
| Tractors and farm equipment | 49 | 41 years | 4.8 |
| Restaurants | 47 | — | 4.2 |
| Household appliances and goods | 46 | — | 4.5 |
| All food and beverage | 43 | — | 4.3 |
| Education | 38 | — | 4.3 |
| Technical construction services | 38 | 32 years | 4 |
| Wholesale of machinery | 32 | 22 years | 3.6 |
| Corporate management | 31 | 33 years | 4.2 |
| Bars, pubs and taverns | 29 | — | 4.2 |
| Other construction | 29 | 19 years | 3.7 |
| Other accommodation | 26 | — | 4.1 |
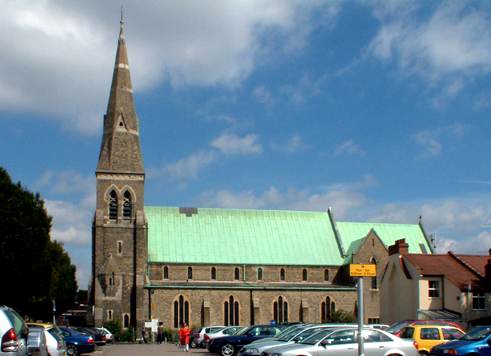
| Churches | 25 | — | 4.7 |
| Beauty salons | 25 | — | 4.8 |
| Construction of buildings | 22 | — | 4.4 |
| Hairdressers | 21 | — | 4.5 |
| Wholesale of construction supplies | 19 | 28 years | 4.2 |
| Hardware store | 19 | — | 4.2 |
| Specialized design | 18 | — | 5 |
| Loan companies | 18 | — | 4 |
Halstead Facts
| Area | 5.9 km² |
| Population | 1,666 |
| Male Population | 819 (49.1%) |
| Female Population | 847 (50.9%) |
| Population change (1975 to 2020) | +10.3% |
| Population change (2000 to 2020) | +10.2% |
| Median Age | 44.4 years (Male: 44.6, Female: 44.3) |
| Neighborhoods | Sible Hedingham, Great Yeldham, Gosfield, Castle Hedingham, Bluebridge Industrial Estate, Halstead |
| Local Time | |
| Timezone | British Summer Time |
| Lat & Lng | 51.32796, 0.13269 |
| Postal Codes | TN14 |
Map of Halstead
Interactive Map
Halstead Population
Years 1975 to 2020
| Data | 1975 | 1990 | 2000 | 2015 | 2020 |
|---|---|---|---|---|---|
| Population | 1,510 | 1,503 | 1,512 | 1,598 | 1,666 |
| Population Density | 254.3 / km² | 253.1 / km² | 254.7 / km² | 269.1 / km² | 280.6 / km² |
Halstead Population change from 2000 to 2015
Increase of 5.7% from year 2000 to 2015
| Location | Change since 1975 | Change since 1990 | Change since 2000 |
|---|---|---|---|
| Halstead | +5.8% | +6.3% | +5.7% |
| United Kingdom | +15.2% | +13.3% | +9.9% |
Halstead Median Age
Median Age: 44.4 years
| Location | Median Age | Median Age (Female) | Median Age (Male) |
|---|---|---|---|
| Halstead | 44.4 yrs | 44.3 yrs | 44.6 yrs |
| United Kingdom | 39.6 yrs | 40.6 yrs | 38.5 yrs |
Halstead Population Density
Population Density: 281 / km²
| Location | Population | Area | Density |
|---|---|---|---|
| Halstead | 1,666 | 5.9 km² | 281 / km² |
| United Kingdom | 64.5 million | 247,916.6 km² | 260 / km² |
Halstead Historical and Projected Population
Estimated Population from 1000 to 2100
- JRC (European Commission's Joint Research Centre) work on the GHS built-up grid
- CIESIN (Center for International Earth Science Information Network)
- [Link] Klein Goldewijk, K., Beusen, A., Doelman, J., and Stehfest, E.: Anthropogenic land use estimates for the Holocene – HYDE 3.2, Earth Syst. Sci. Data, 9, 927–953, https://doi.org/10.5194/essd-9-927-2017, 2017.
Neighborhoods in Halstead
Percentage of businesses by neighborhood in Halstead
Area Codes
Percentage Area Codes used by businesses in Halstead
Price Distribution
Business distribution by price for Halstead
Human Development Index (HDI)
Statistic composite index of life expectancy, education, and per capita income.
Halstead CO2 Emissions
Carbon Dioxide (CO2) Emissions Per Capita in Tonnes Per Year
| Location | CO2 Emissions | CO2 Emissions Per Capita | CO2 Emissions Intensity |
|---|---|---|---|
| Halstead | 21,097 tn | 12.66 tn | 3,553.2 tons/km² |
| United Kingdom | 735,672,544 tn | 11.4 tn | 2,967.4 tons/km² |
| 2013 CO2 emissions (tonnes/year) | 21,097 tn |
| 2013 CO2 emissions (tonnes/year) per capita | 12.66 tn |
| 2013 CO2 emissions intensity (tonnes/km²/year) | 3,553.2 tons/km² |
Natural Hazards Risk
Relative risk out of 10
| Hazard | Risk Level |
|---|---|
| Flood | High (10) |
* Risk, particularly concerning flood or landslide, may not be for the entire area.
- Dilley, M., R.S. Chen, U. Deichmann, A.L. Lerner-Lam, M. Arnold, J. Agwe, P. Buys, O. Kjekstad, B. Lyon, and G. Yetman. 2005. Natural Disaster Hotspots: A Global Risk Analysis. Washington, D.C.: World Bank. https://doi.org/10.1596/0-8213-5930-4.
- Center for Hazards and Risk Research - CHRR - Columbia University, Center for International Earth Science Information Network - CIESIN - Columbia University. 2005. Global Flood Hazard Frequency and Distribution. Palisades, NY: NASA Socioeconomic Data and Applications Center (SEDAC). https://doi.org/10.7927/H4668B3D.
Recent Nearby Earthquakes
Magnitude 3.0 and greater
| Date▼ | Time↕ | Magnitude↕ | Distance↕ | Depth↕ | Location↕ | Link |
|---|---|---|---|---|---|---|
| 2/27/19 | 3:42 AM | 3.3 | 32.7 km | 10,000 m | 3km SE of Dorking, United Kingdom | usgs.gov |
| 5/22/15 | 1:52 AM | 3.7 | 91 km | 12,000 m | 3km SSE of Ramsgate, United Kingdom | usgs.gov |
| 3/3/09 | 2:35 PM | 3.5 | 76.7 km | 3,500 m | England, United Kingdom | usgs.gov |
| 4/28/07 | 7:18 AM | 4.6 | 66.9 km | 10,000 m | England, United Kingdom | usgs.gov |
| 9/9/95 | 6:20 PM | 3.3 | 94.2 km | 10,000 m | England, United Kingdom | usgs.gov |
| 12/2/85 | 5:40 PM | 3.3 | 64.2 km | 13,000 m | England, United Kingdom | usgs.gov |
| 4/15/85 | 7:02 PM | 3.4 | 88.6 km | 10,000 m | England, United Kingdom | usgs.gov |
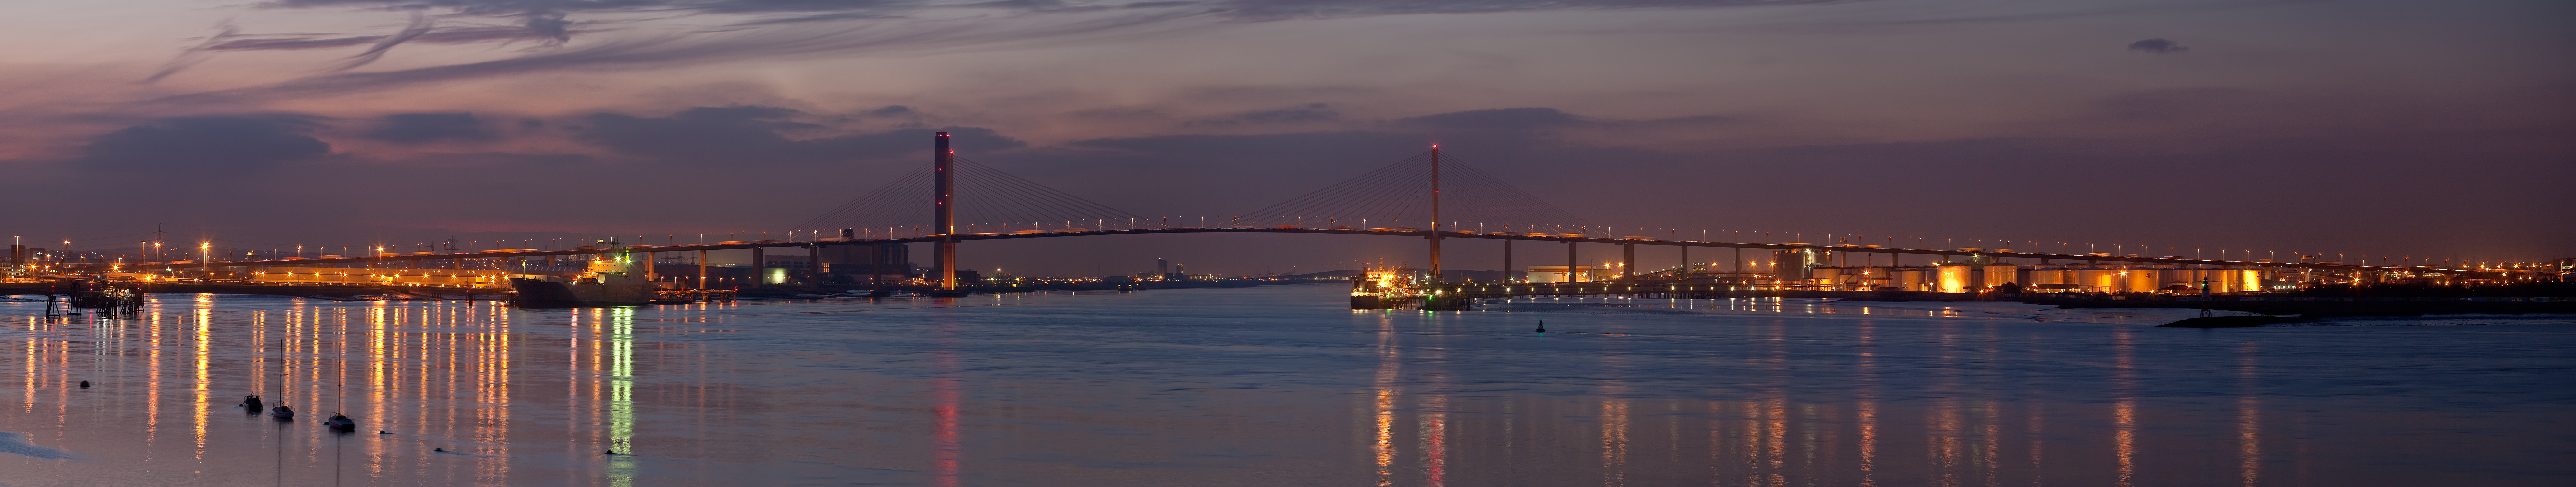
Fort Halstead
Fort Halstead is a research site of Dstl, an executive agency of the UK Ministry of Defence. It is situated on the crest of the Kentish North Downs, overlooking the town of Sevenoaks. Originally constructed in 1892 as one of a ring of fortresses arou..
Fort Halstead Wikipedia Page
About Our Data
The data on this page is estimated using a number of publicly available tools and resources. It is provided without warranty, and could contain inaccuracies. Use at your own risk.