Categories in Keith, Moray
Industries
Business Distribution by Industry in Keith, Moray
| Industry Description | Number of Establishments | Average Age of Business | Average Google Rating |
|---|---|---|---|
| Shopping | 51 | — | 4.6 |
| All food and beverage | 40 | 16 years | 4.7 |
| Grocery stores and supermarkets | 40 | 16 years | 4.6 |
| Tractors and farm equipment | 28 | — | 4.3 |
| Other accommodation | 22 | — | 4.4 |
| Restaurants | 16 | — | 4.2 |
| Bed and breakfasts | 13 | — | 4.7 |
| Bottled water and beverages | 13 | — | 4.6 |
| Household appliances and goods | 10 | — | 4.8 |
| General contractors | 10 | — | 4 |
| Education | 10 | — | 3.6 |
| Car repair | 10 | — | 4.7 |
| Bars, pubs and taverns | 9 | — | 4.3 |
| Gifts, cards and party supplies | 8 | — | 4.5 |
| Hairdressers | 7 | — | 4.4 |
| Beauty salons | 7 | — | 4.5 |
| Street vendors | 7 | — | 4 |
| Other membership organizations | 7 | — | 4.6 |
| Hotels and motels | 7 | — | 4.1 |
| Primary and elementary schools | 6 | — | 3.4 |
| Shopping other | 6 | — | 4.6 |
| Churches | 6 | — | 4.3 |
| Religion | 6 | — | 4.3 |
| Furniture stores | 6 | — | 4.1 |
| Construction of buildings | 5 | — | 3.4 |
Keith, Moray Facts
| Area | 1.8 km² |
| Population | 3,057 |
| Male Population | 1,483 (48.5%) |
| Female Population | 1,574 (51.5%) |
| Population change (1975 to 2020) | +16.1% |
| Population change (2000 to 2020) | +8.8% |
| Median Age | 46.6 years (Male: 44.7, Female: 48.5) |
| Area Codes | 1542 |
| Neighborhoods | Dufftown, Town Centre, Newmill, Grange, Mulben |
| Local Time | |
| Timezone | British Summer Time |
| Lat & Lng | 57.53633, -2.94811 |
| Postal Codes | AB5, AB54, AB55, AB56 |
Map of Keith, Moray
Interactive Map
Keith, Moray Population
Years 1975 to 2020
| Data | 1975 | 1990 | 2000 | 2015 | 2020 |
|---|---|---|---|---|---|
| Population | 2,633 | 2,725 | 2,809 | 3,071 | 3,057 |
| Population Density | 1,504.6 / km² | 1,557.1 / km² | 1,605.1 / km² | 1,754.9 / km² | 1,746.9 / km² |
Keith, Moray Population change from 2000 to 2015
Increase of 9.3% from year 2000 to 2015
| Location | Change since 1975 | Change since 1990 | Change since 2000 |
|---|---|---|---|
| Keith, Moray | +16.6% | +12.7% | +9.3% |
| United Kingdom | +15.2% | +13.3% | +9.9% |
Keith, Moray Median Age
Median Age: 46.6 years
| Location | Median Age | Median Age (Female) | Median Age (Male) |
|---|---|---|---|
| Keith, Moray | 46.6 yrs | 48.5 yrs | 44.7 yrs |
| United Kingdom | 39.6 yrs | 40.6 yrs | 38.5 yrs |
Keith, Moray Population Density
Population Density: 1,747 / km²
| Location | Population | Area | Density |
|---|---|---|---|
| Keith, Moray | 3,057 | 1.75 km² | 1,747 / km² |
| United Kingdom | 64.5 million | 247,916.6 km² | 260 / km² |
Keith, Moray Historical and Projected Population
Estimated Population from 0 to 2100
- JRC (European Commission's Joint Research Centre) work on the GHS built-up grid
- CIESIN (Center for International Earth Science Information Network)
- [Link] Klein Goldewijk, K., Beusen, A., Doelman, J., and Stehfest, E.: Anthropogenic land use estimates for the Holocene – HYDE 3.2, Earth Syst. Sci. Data, 9, 927–953, https://doi.org/10.5194/essd-9-927-2017, 2017.
Neighborhoods in Keith, Moray
Percentage of businesses by neighborhood in Keith, Moray
Area Codes
Percentage Area Codes used by businesses in Keith, Moray
Price Distribution
Business distribution by price for Keith, Moray
Human Development Index (HDI)
Statistic composite index of life expectancy, education, and per capita income.
Keith, Moray CO2 Emissions
Carbon Dioxide (CO2) Emissions Per Capita in Tonnes Per Year
| Location | CO2 Emissions | CO2 Emissions Per Capita | CO2 Emissions Intensity |
|---|---|---|---|
| Keith, Moray | 34,232 tn | 11.2 tn | 19,561 tons/km² |
| United Kingdom | 735,672,544 tn | 11.4 tn | 2,967.4 tons/km² |
| 2013 CO2 emissions (tonnes/year) | 34,232 tn |
| 2013 CO2 emissions (tonnes/year) per capita | 11.2 tn |
| 2013 CO2 emissions intensity (tonnes/km²/year) | 19,561 tons/km² |
Natural Hazards Risk
Relative risk out of 10
| Hazard | Risk Level |
|---|---|
| Flood | Medium (4) |
* Risk, particularly concerning flood or landslide, may not be for the entire area.
- Dilley, M., R.S. Chen, U. Deichmann, A.L. Lerner-Lam, M. Arnold, J. Agwe, P. Buys, O. Kjekstad, B. Lyon, and G. Yetman. 2005. Natural Disaster Hotspots: A Global Risk Analysis. Washington, D.C.: World Bank. https://doi.org/10.1596/0-8213-5930-4.
- Center for Hazards and Risk Research - CHRR - Columbia University, Center for International Earth Science Information Network - CIESIN - Columbia University. 2005. Global Flood Hazard Frequency and Distribution. Palisades, NY: NASA Socioeconomic Data and Applications Center (SEDAC). https://doi.org/10.7927/H4668B3D.
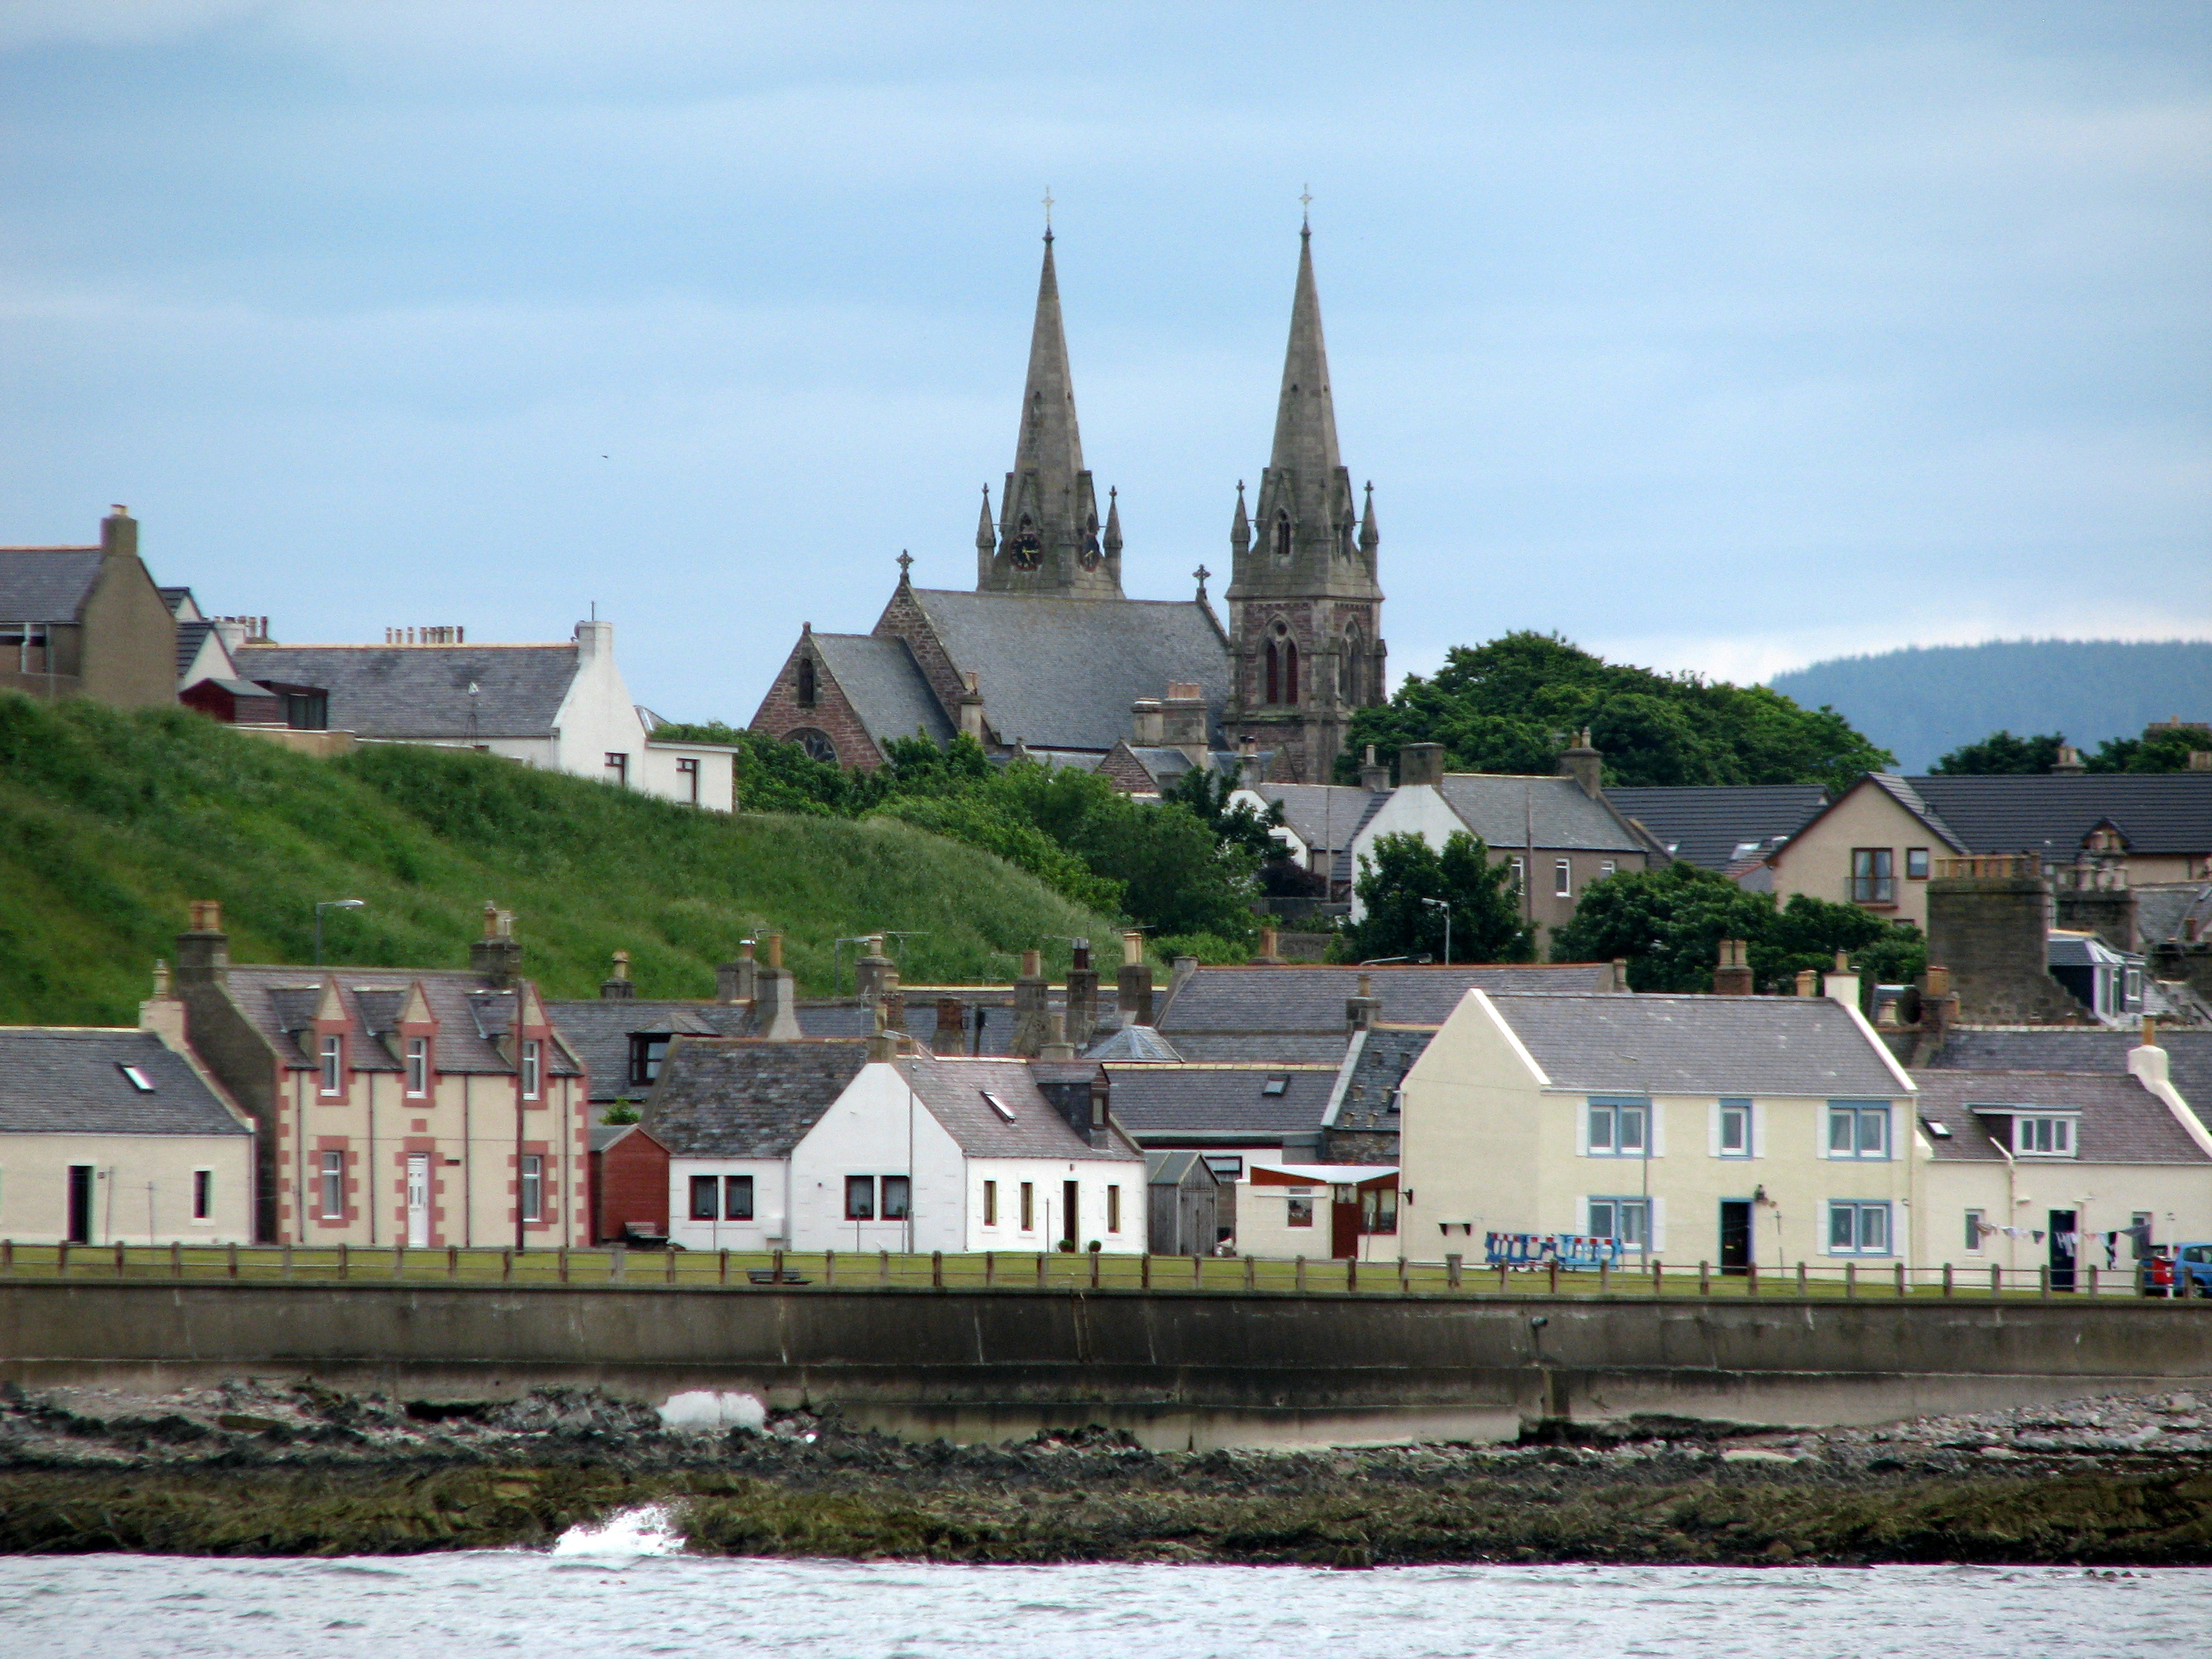
Keith, Moray
(Scottish Gaelic: Baile Chèith, or Cèith Mhaol Rubha (archaic)) is a small town in the Moray council area in north east Scotland. It has a population of 4,734. 1975 it was in Banffshire, a name which persists in common usage and historical referen..
Keith, Moray Wikipedia Page

About Our Data
The data on this page is estimated using a number of publicly available tools and resources. It is provided without warranty, and could contain inaccuracies. Use at your own risk.