Categories in Ramsgate
Industries
Business Distribution by Industry in Ramsgate
| Industry Description | Number of Establishments | Average Age of Business |
|---|---|---|
| Shopping | 281 | 27 years |
| Shopping other | 269 | 22 years |
| Restaurants | 264 | 19 years |
| Corporate management | 184 | 26 years |
| Construction of buildings | 123 | 25 years |
| Real estate | 116 | 26 years |
| Other construction | 115 | 24 years |
| Other accommodation | 94 | 23 years |
| General contractors | 93 | 36 years |
| Beauty salons | 88 | — |
| Health and medical | 88 | 33 years |
| Electrical installation | 86 | 23 years |
| Bars, pubs and taverns | 85 | 45 years |
| Car repair | 81 | 19 years |
Ramsgate Facts
| Area | 9.9 km² |
| Population | 45,209 |
| Male Population | 21,923 (48.5%) |
| Female Population | 23,286 (51.5%) |
| Population change (1975 to 2020) | +22.5% |
| Population change (2000 to 2020) | +19.8% |
| Median Age | 40.7 years (Male: 39.8, Female: 41.4) |
| Neighborhoods | Minster, Town Centre, Cliffsend, Manston, Monkton |
| Local Time | |
| Timezone | British Summer Time |
| Lat & Lng | 51.33568, 1.41797 |
| Postal Codes | CT10, CT11, CT12 |
Map of Ramsgate
Interactive Map
Ramsgate Population
Years 1975 to 2030
| Data | 1975 | 1990 | 2000 | 2015 | 2020 | 2025* | 2030* |
|---|---|---|---|---|---|---|---|
| Population | 36,897 | 37,039 | 37,735 | 40,568 | 45,209 | 46,581 | 47,769 |
| Population Density | 3,712.9 / km² | 3,727.2 / km² | 3,797.2 / km² | 4,082.3 / km² | 4,549.3 / km² | 4,687.4 / km² | 4,806.9 / km² |
Ramsgate Population change from 2000 to 2020
Increase of 19.8% from year 2000 to 2020
| Location | Change since 1975 | Change since 1990 | Change since 2000 |
|---|---|---|---|
| Ramsgate | +22.5% | +22.1% | +19.8% |
| United Kingdom | — | — | — |
Ramsgate Median Age
Median Age: 40.7 years
| Location | Median Age | Median Age (Female) | Median Age (Male) |
|---|---|---|---|
| Ramsgate | 40.7 yrs | 41.4 yrs | 39.8 yrs |
| United Kingdom | 39.6 yrs | 40.6 yrs | 38.5 yrs |
Ramsgate Population Density
Population Density: 4,549 / km²
| Location | Population | Area | Density |
|---|---|---|---|
| Ramsgate | 45,209 | 9.9 km² | 4,549 / km² |
| United Kingdom | 64.5 million | 247,916.6 km² | 260 / km² |
Ramsgate Historical and Projected Population
Estimated Population from 1200 to 2100
- JRC (European Commission's Joint Research Centre) work on the GHS built-up grid
- CIESIN (Center for International Earth Science Information Network)
- [Link] Klein Goldewijk, K., Beusen, A., Doelman, J., and Stehfest, E.: Anthropogenic land use estimates for the Holocene – HYDE 3.2, Earth Syst. Sci. Data, 9, 927–953, https://doi.org/10.5194/essd-9-927-2017, 2017.
Neighborhoods in Ramsgate
Percentage of businesses by neighborhood in Ramsgate
Area Codes
Percentage Area Codes used by businesses in Ramsgate
Postal Codes
Percentage of businesses by Postal Codes in Ramsgate
Price Distribution
Business distribution by price for Ramsgate
Human Development Index (HDI)
Statistic composite index of life expectancy, education, and per capita income.
Ramsgate CO2 Emissions
Carbon Dioxide (CO2) Emissions Per Capita in Tonnes Per Year
| Location | CO2 Emissions | CO2 Emissions Per Capita | CO2 Emissions Intensity |
|---|---|---|---|
| Ramsgate | 495,974 tn | 10.97 tn | 49,909.4 tons/km² |
| United Kingdom | 735,672,544 tn | 11.4 tn | 2,967.4 tons/km² |
| 2013 CO2 emissions (tonnes/year) | 495,974 tn |
| 2013 CO2 emissions (tonnes/year) per capita | 10.97 tn |
| 2013 CO2 emissions intensity (tonnes/km²/year) | 49,909.4 tons/km² |
Natural Hazards Risk
Relative risk out of 10
| Hazard | Risk Level |
|---|---|
| Flood | High (9) |
* Risk, particularly concerning flood or landslide, may not be for the entire area.
- Dilley, M., R.S. Chen, U. Deichmann, A.L. Lerner-Lam, M. Arnold, J. Agwe, P. Buys, O. Kjekstad, B. Lyon, and G. Yetman. 2005. Natural Disaster Hotspots: A Global Risk Analysis. Washington, D.C.: World Bank. https://doi.org/10.1596/0-8213-5930-4.
- Center for Hazards and Risk Research - CHRR - Columbia University, Center for International Earth Science Information Network - CIESIN - Columbia University. 2005. Global Flood Hazard Frequency and Distribution. Palisades, NY: NASA Socioeconomic Data and Applications Center (SEDAC). https://doi.org/10.7927/H4668B3D.
Recent Nearby Earthquakes
Magnitude 3.0 and greater
| Date▼ | Time↕ | Magnitude↕ | Distance↕ | Depth↕ | Location↕ | Link |
|---|---|---|---|---|---|---|
| 5/22/15 | 1:52 AM | 3.7 | 3.8 km | 12,000 m | 3km SSE of Ramsgate, United Kingdom | usgs.gov |
| 3/3/09 | 2:35 PM | 3.5 | 29.6 km | 3,500 m | England, United Kingdom | usgs.gov |
| 4/28/07 | 7:18 AM | 4.6 | 39.9 km | 10,000 m | England, United Kingdom | usgs.gov |
| 1/23/07 | 5:32 PM | 4.1 | 60.7 km | 10,000 m | North Sea | usgs.gov |
| 7/2/01 | 4:06 PM | 3.1 | 92 km | 5,000 m | Belgium | usgs.gov |
| 11/25/98 | 9:22 PM | 3 | 48 km | 10,000 m | North Sea | usgs.gov |
| 1/27/98 | 8:36 AM | 3.8 | 94.2 km | 2,000 m | France | usgs.gov |
| 2/13/97 | 2:31 PM | 3.2 | 92.1 km | 5,000 m | France | usgs.gov |
| 3/28/96 | 7:37 PM | 3 | 96.2 km | 10,000 m | North Sea | usgs.gov |
| 9/15/94 | 6:36 AM | 3.9 | 41.4 km | 10,000 m | England, United Kingdom | usgs.gov |
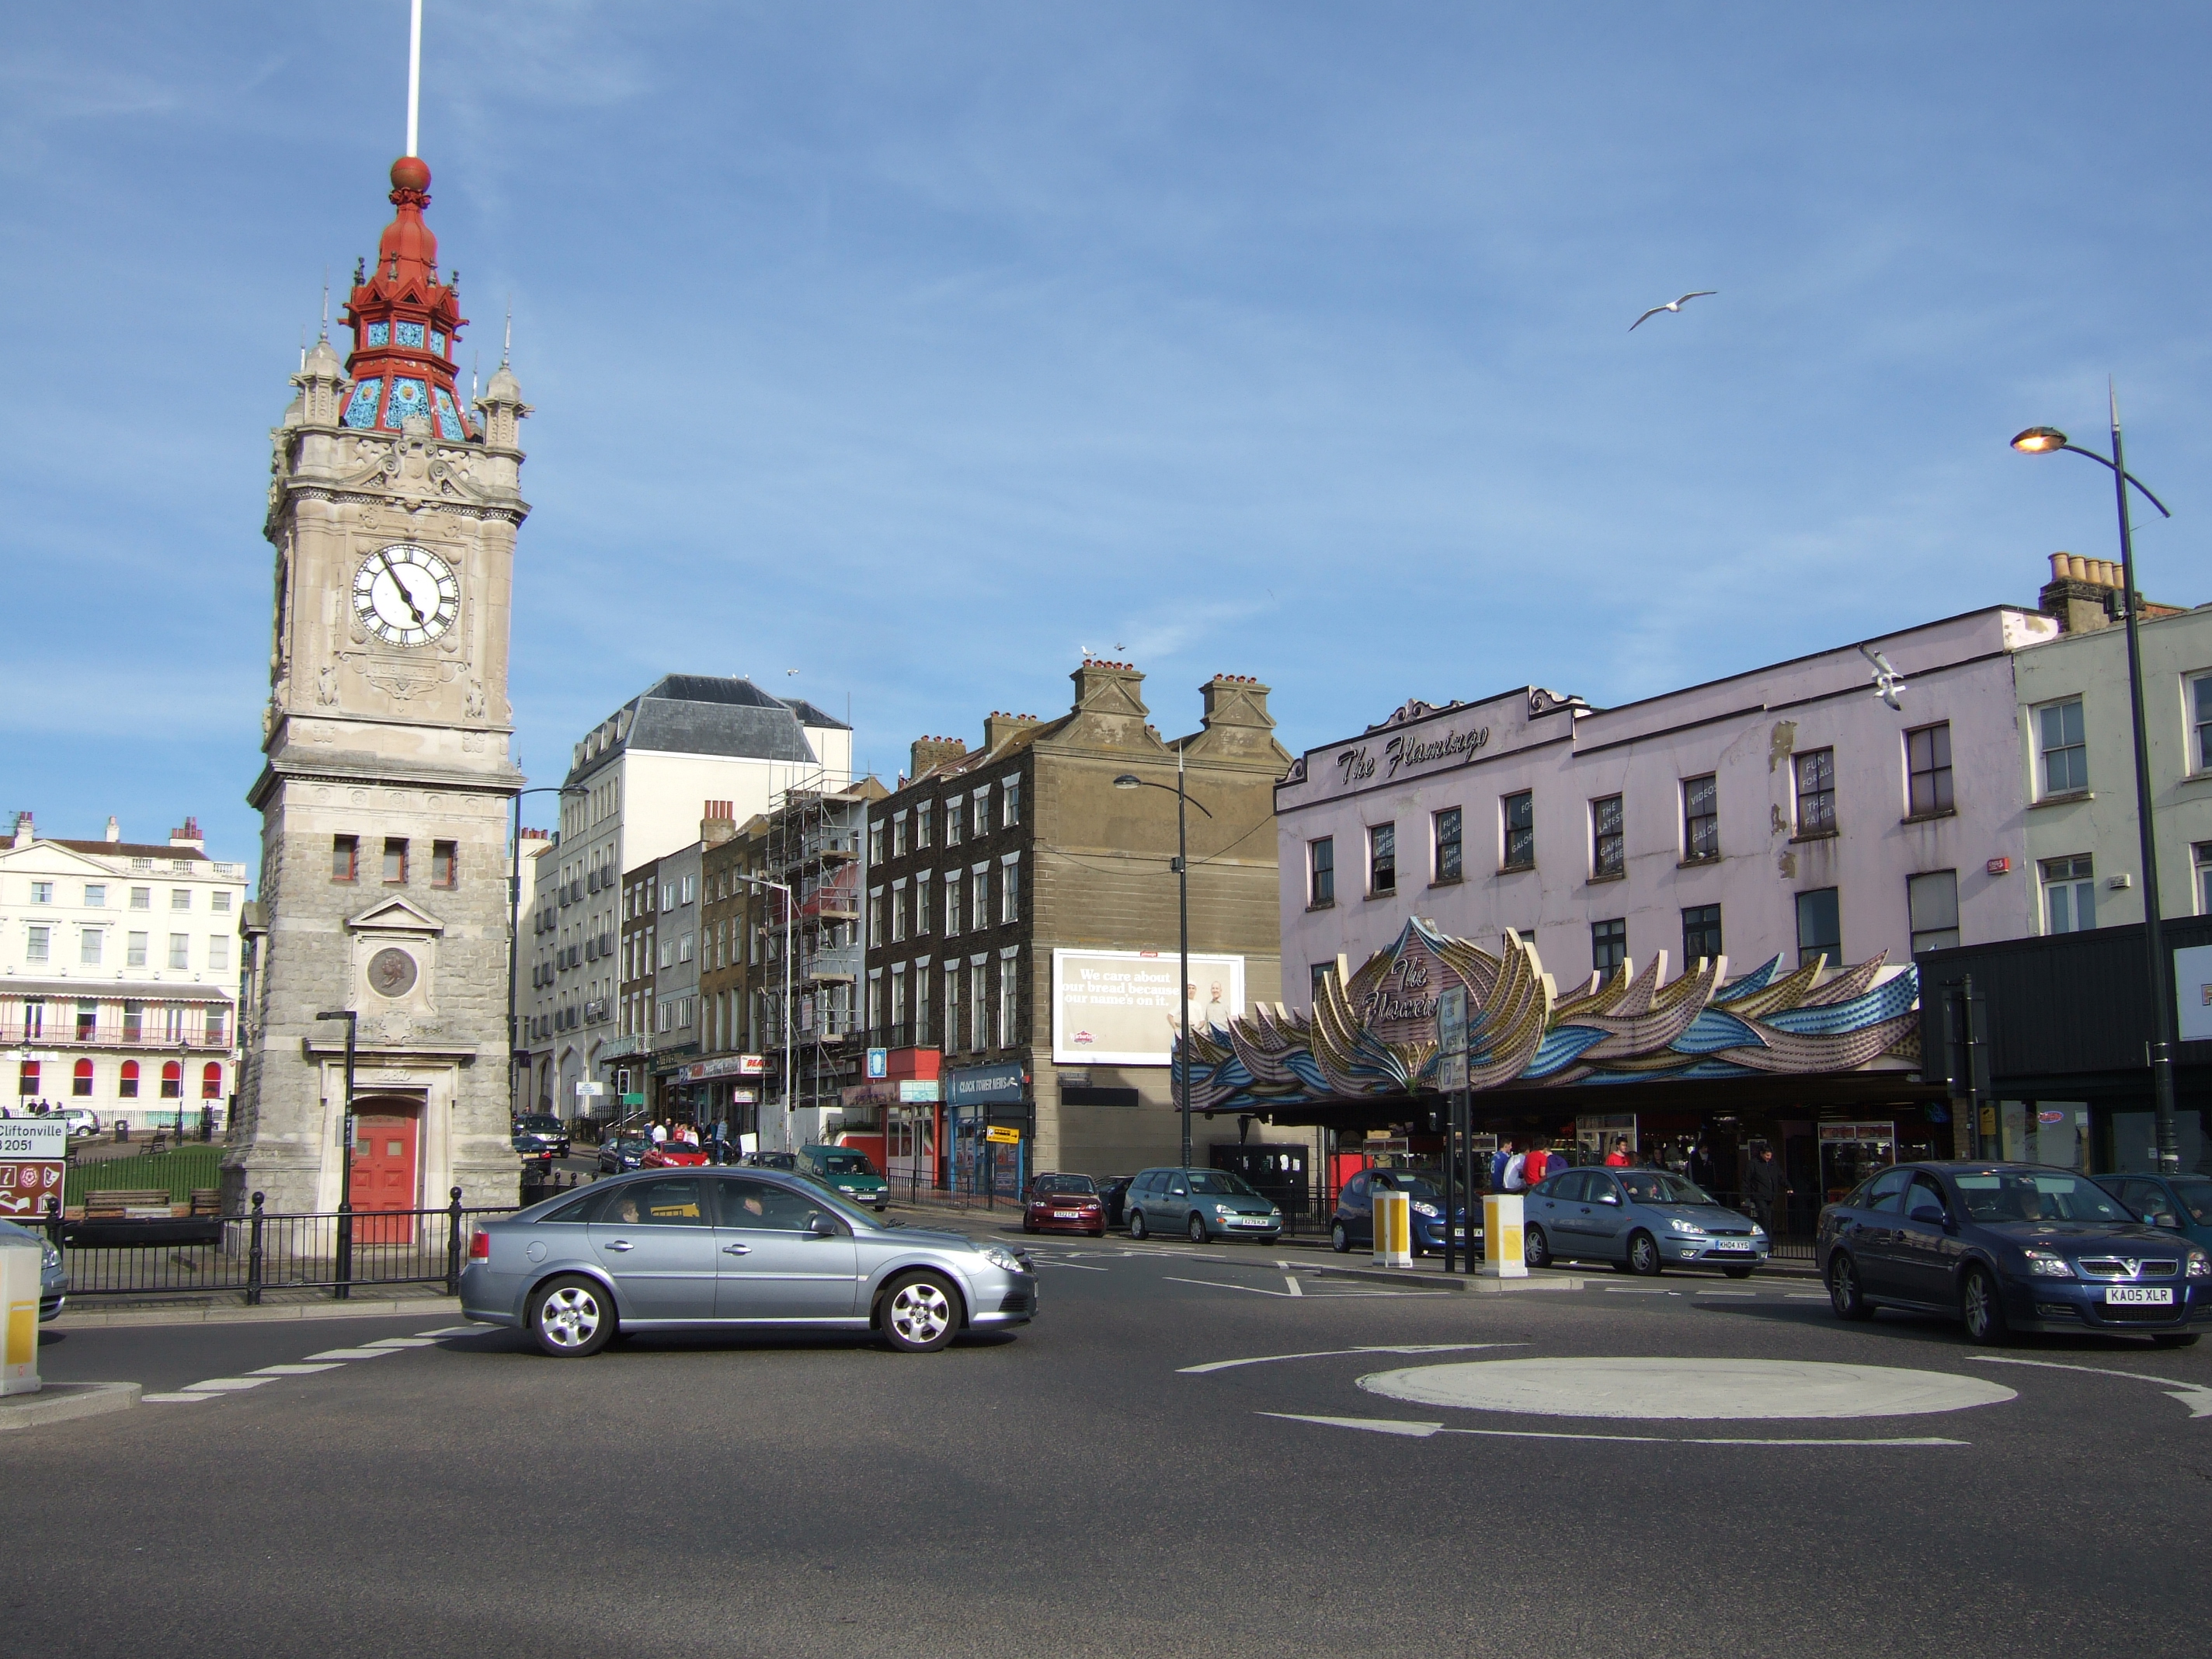
Ramsgate
is a seaside town in the district of Thanet in east Kent, England. It was one of the great English seaside towns of the 19th century. As of 2001 it had a population of around 40,000. Ramsgate’s main attraction is its coastline, and its main industr..
Ramsgate Wikipedia Page

About Our Data
The data on this page is estimated using a number of publicly available tools and resources. It is provided without warranty, and could contain inaccuracies. Use at your own risk.