Industries
Business Distribution by Industry in Silloth
| Industry Description | Number of Establishments |
|---|---|
| Restaurants | 6 |
Silloth Facts
| Area | 1.9 km² |
| Population | 1,086 |
| Male Population | 497 (45.7%) |
| Female Population | 589 (54.3%) |
| Population change (1975 to 2020) | +0.5% |
| Population change (2000 to 2020) | +1.6% |
| Median Age | 41.2 years (Male: 42.2, Female: 40) |
| Neighborhoods | Silloth, Causewayhead, Blackdyke |
| Local Time | |
| Timezone | British Summer Time |
| Lat & Lng | 54.86870, -3.38448 |
| Postal Codes | CA5, CA7 |
Map of Silloth
Interactive Map
Silloth Population
Years 1975 to 2020
| Data | 1975 | 1990 | 2000 | 2015 | 2020 |
|---|---|---|---|---|---|
| Population | 1,081 | 1,072 | 1,069 | 1,110 | 1,086 |
| Population Density | 557.9 / km² | 553.3 / km² | 551.7 / km² | 572.9 / km² | 560.5 / km² |
Silloth Population change from 2000 to 2015
Increase of 3.8% from year 2000 to 2015
| Location | Change since 1975 | Change since 1990 | Change since 2000 |
|---|---|---|---|
| Silloth | +2.7% | +3.5% | +3.8% |
| United Kingdom | +15.2% | +13.3% | +9.9% |
Silloth Median Age
Median Age: 41.2 years
| Location | Median Age | Median Age (Female) | Median Age (Male) |
|---|---|---|---|
| Silloth | 41.2 yrs | 40 yrs | 42.2 yrs |
| United Kingdom | 39.6 yrs | 40.6 yrs | 38.5 yrs |
Silloth Population Density
Population Density: 561 / km²
| Location | Population | Area | Density |
|---|---|---|---|
| Silloth | 1,086 | 1.938 km² | 561 / km² |
| United Kingdom | 64.5 million | 247,916.6 km² | 260 / km² |
Silloth Historical and Projected Population
Estimated Population from 0 to 2100
- JRC (European Commission's Joint Research Centre) work on the GHS built-up grid
- CIESIN (Center for International Earth Science Information Network)
- [Link] Klein Goldewijk, K., Beusen, A., Doelman, J., and Stehfest, E.: Anthropogenic land use estimates for the Holocene – HYDE 3.2, Earth Syst. Sci. Data, 9, 927–953, https://doi.org/10.5194/essd-9-927-2017, 2017.
Area Codes
Percentage Area Codes used by businesses in Silloth
Price Distribution
Business distribution by price for Silloth
Human Development Index (HDI)
Statistic composite index of life expectancy, education, and per capita income.
Silloth CO2 Emissions
Carbon Dioxide (CO2) Emissions Per Capita in Tonnes Per Year
| Location | CO2 Emissions | CO2 Emissions Per Capita | CO2 Emissions Intensity |
|---|---|---|---|
| Silloth | 13,605 tn | 12.53 tn | 7,021.7 tons/km² |
| United Kingdom | 735,672,544 tn | 11.4 tn | 2,967.4 tons/km² |
| 2013 CO2 emissions (tonnes/year) | 13,605 tn |
| 2013 CO2 emissions (tonnes/year) per capita | 12.53 tn |
| 2013 CO2 emissions intensity (tonnes/km²/year) | 7,021.7 tons/km² |
Recent Nearby Earthquakes
Magnitude 3.0 and greater
| Date▼ | Time↕ | Magnitude↕ | Distance↕ | Depth↕ | Location↕ | Link |
|---|---|---|---|---|---|---|
| 12/21/10 | 10:59 PM | 3.5 | 55.5 km | 12,600 m | England, United Kingdom | usgs.gov |
| 4/28/09 | 10:22 AM | 3.7 | 81.7 km | 8,800 m | England, United Kingdom | usgs.gov |
| 12/26/06 | 10:40 AM | 3.6 | 28.9 km | 7,700 m | Scotland, United Kingdom | usgs.gov |
| 6/26/93 | 5:42 AM | 3 | 99.6 km | 10,000 m | England, United Kingdom | usgs.gov |
| 9/12/88 | 2:23 PM | 3.7 | 78.4 km | 10,000 m | England, United Kingdom | usgs.gov |
| 12/26/79 | 3:57 AM | 4.5 | 45.2 km | 10,000 m | England, United Kingdom | usgs.gov |
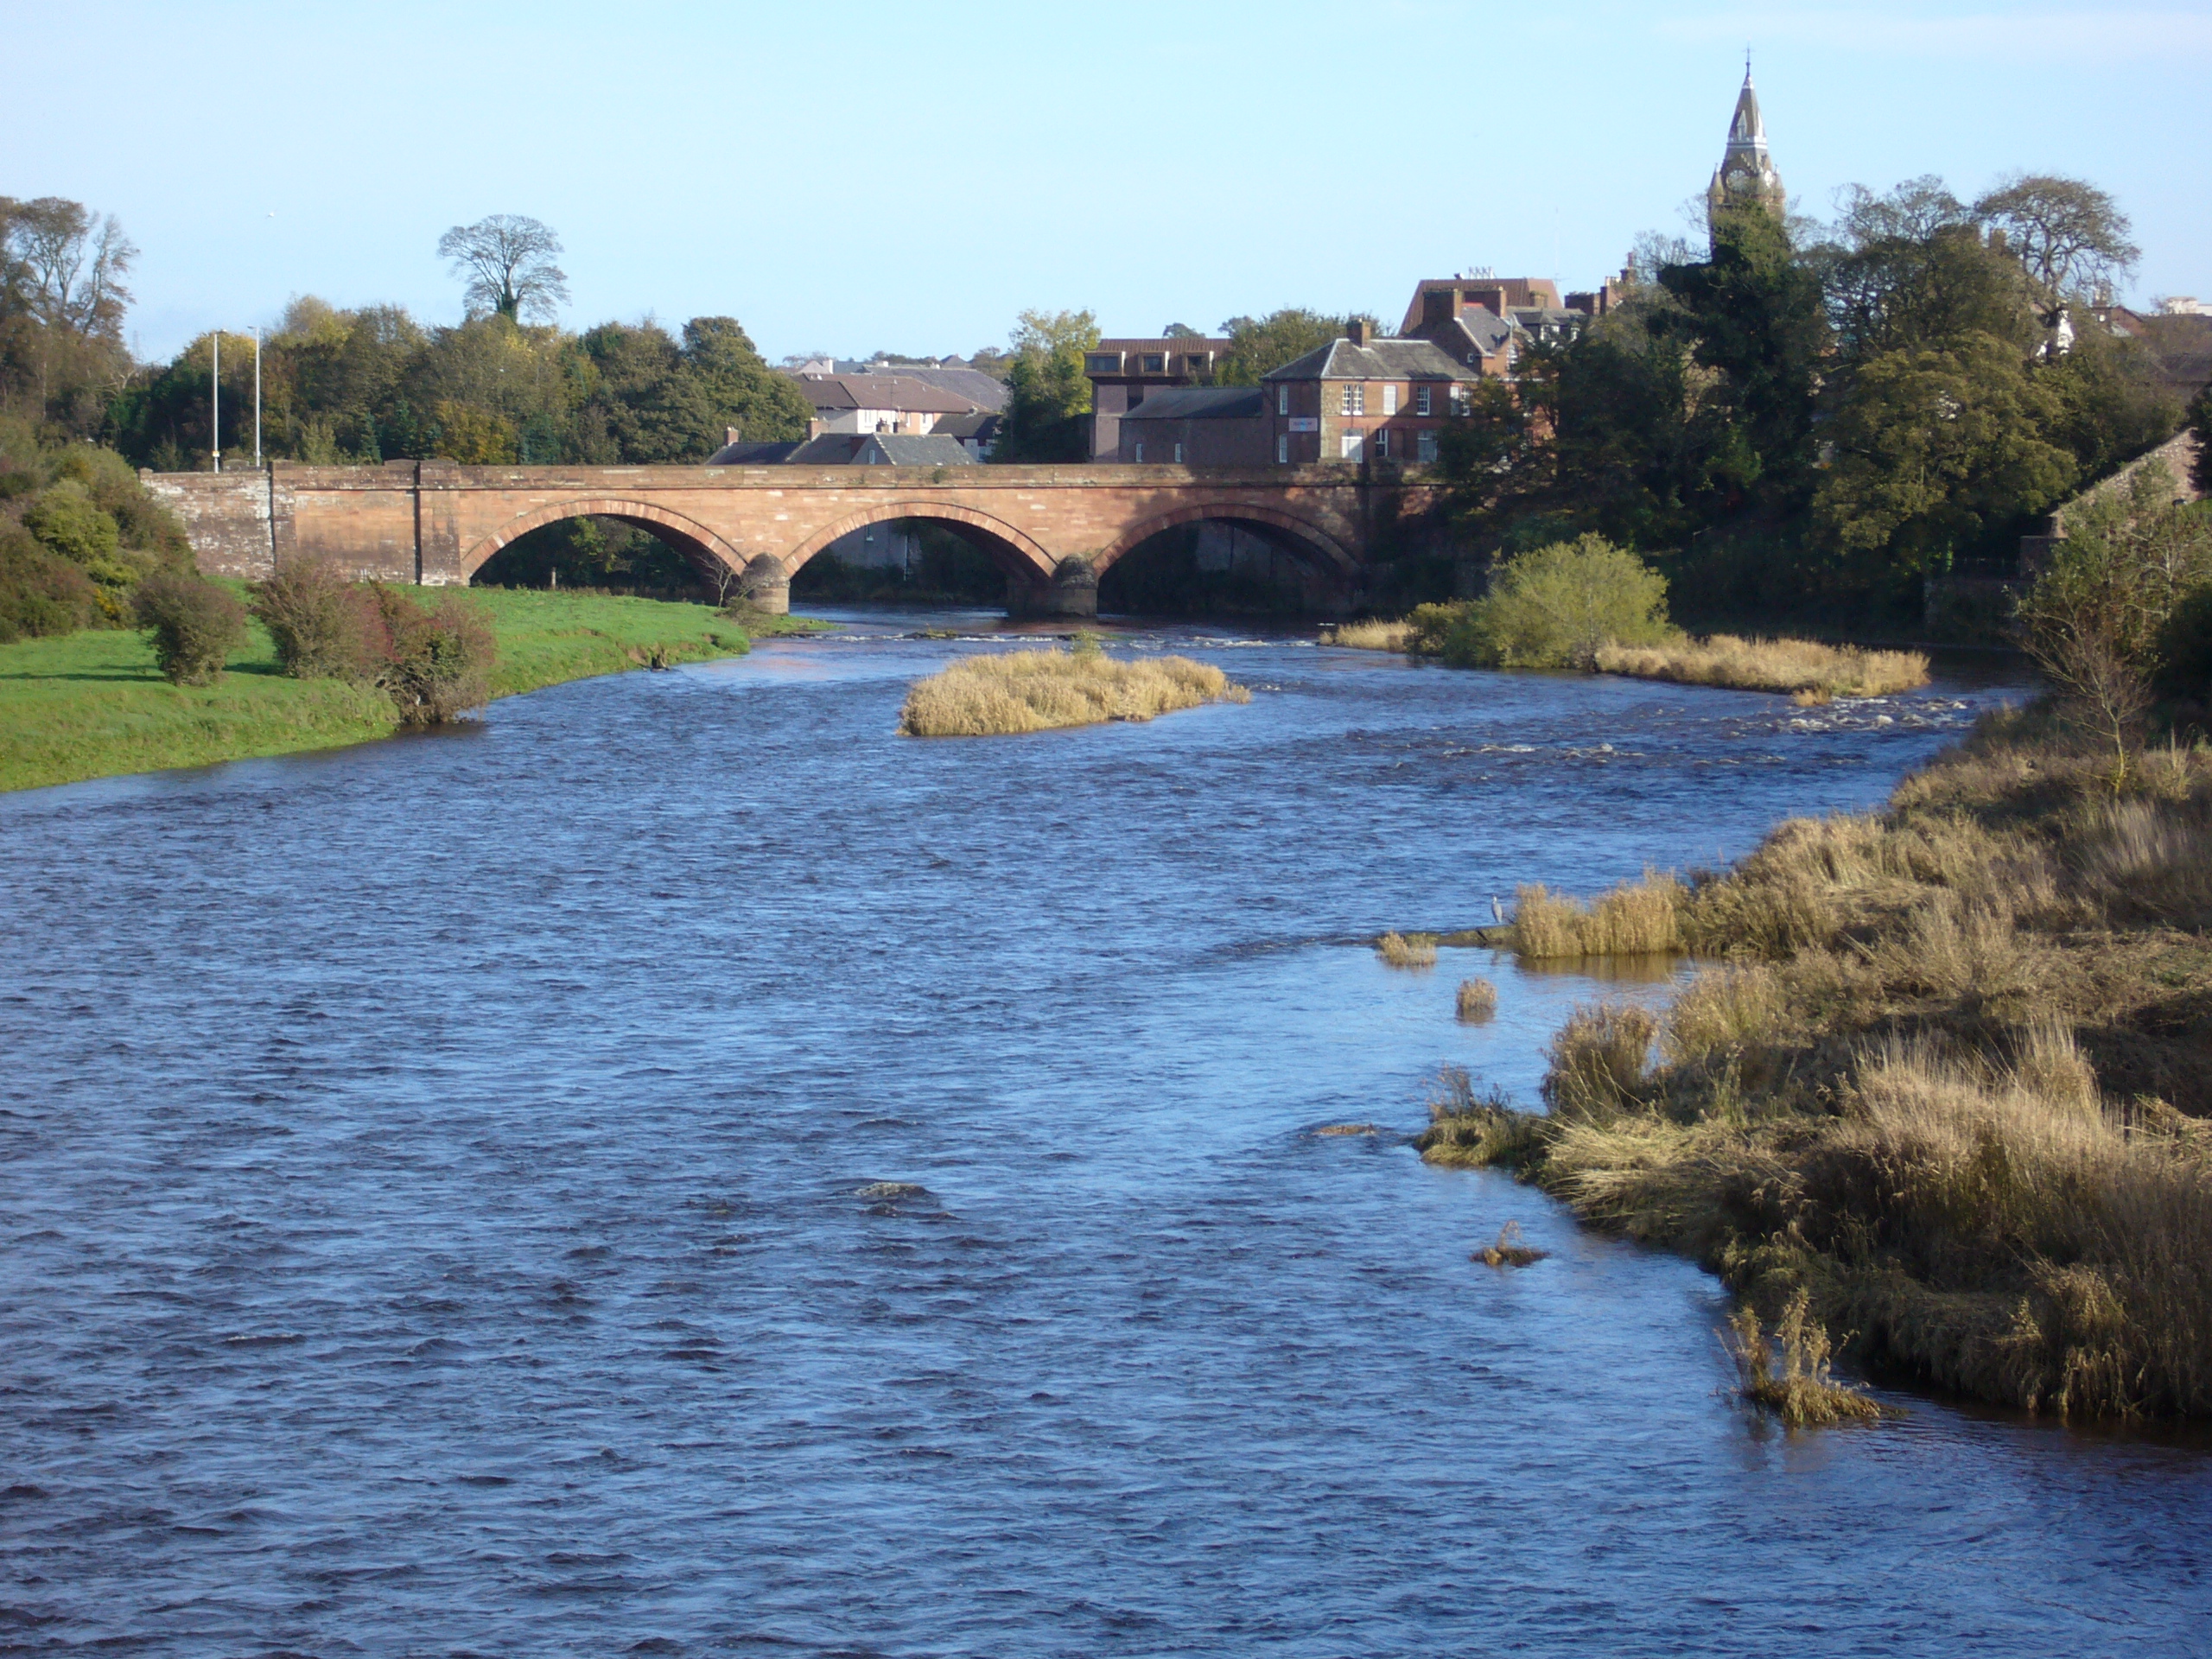
Silloth
(sometimes known as Silloth-on-Solway) is a port town and civil parish in Cumbria, England. It sits on the shoreline of the Solway Firth, 22 miles (35 km) west of Carlisle. The town of Maryport lies 12 miles (19 km) miles to the south, down the B53..
Silloth Wikipedia Page


About Our Data
The data on this page is estimated using a number of publicly available tools and resources. It is provided without warranty, and could contain inaccuracies. Use at your own risk.