Categories in Wareham, Dorset
Industries
Business Distribution by Industry in Wareham, Dorset
| Industry Description | Number of Establishments | Average Age of Business | Average Google Rating |
|---|---|---|---|
| Shopping | 137 | 20 years | 4.2 |
| Other accommodation | 103 | — | 4.4 |
| Restaurants | 56 | — | 4.3 |
| All food and beverage | 47 | — | 4.2 |
| Grocery stores and supermarkets | 46 | — | 4.1 |
| Bed and breakfasts | 44 | — | 4.5 |
| Bars, pubs and taverns | 43 | — | 4.3 |
| Shopping other | 42 | — | 4.6 |
| Hotels and motels | 37 | — | 4.3 |
| Education | 36 | — | 4.3 |
| General contractors | 31 | 23 years | 4.6 |
| Tractors and farm equipment | 29 | — | 4.3 |
| Sports and recreation | 25 | — | 4.3 |
| Campgrounds | 24 | — | 4.5 |
| Car repair | 23 | — | 4 |
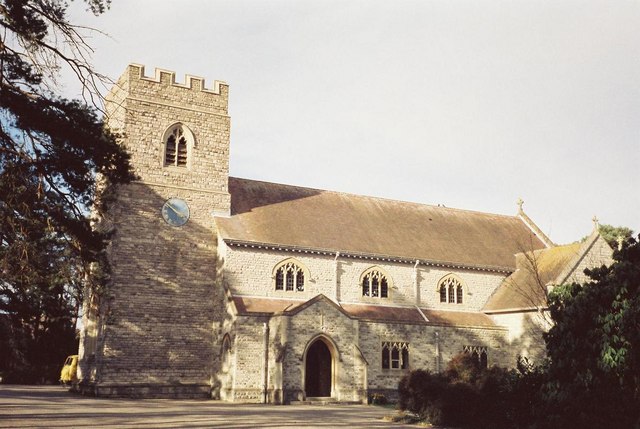
| Churches | 22 | — | 4.4 |
| Secondary education | 22 | — | 4 |
| Health and medical | 21 | — | 4.1 |
| Household appliances and goods | 19 | — | 4.7 |
| Cafes | 19 | — | 4.4 |
| Holiday homes, cabins and resorts | 18 | — | 4.4 |
| Wholesale of machinery | 18 | 28 years | 4.3 |
| Religion | 17 | — | 4.2 |
| Construction of buildings | 17 | — | 4.9 |
| Electronics stores | 16 | 19 years | 4.8 |
Wareham, Dorset Facts
| Area | 2.1 km² |
| Population | 4,008 |
| Male Population | 1,878 (46.9%) |
| Female Population | 2,130 (53.1%) |
| Population change (1975 to 2020) | -6.8% |
| Population change (2000 to 2020) | +2.2% |
| Median Age | 49.4 years (Male: 47.3, Female: 51.1) |
| Area Codes | 1929 |
| Neighborhoods | Bere Regis, Wool, Corfe Castle, Sandford, Bovington |
| Local Time | |
| Timezone | British Summer Time |
| Lat & Lng | 50.68886, -2.11040 |
| Postal Codes | BH20 |
Map of Wareham, Dorset
Interactive Map
Wareham, Dorset Population
Years 1975 to 2020
| Data | 1975 | 1990 | 2000 | 2015 | 2020 |
|---|---|---|---|---|---|
| Population | 4,301 | 4,043 | 3,923 | 3,880 | 4,008 |
| Population Density | 2,024 / km² | 1,902.6 / km² | 1,846.1 / km² | 1,825.9 / km² | 1,886.1 / km² |
Wareham, Dorset Population change from 2000 to 2015
Decrease of 1.1% from year 2000 to 2015
| Location | Change since 1975 | Change since 1990 | Change since 2000 |
|---|---|---|---|
| Wareham, Dorset | -9.8% | -4% | -1.1% |
| United Kingdom | +15.2% | +13.3% | +9.9% |
Wareham, Dorset Median Age
Median Age: 49.4 years
| Location | Median Age | Median Age (Female) | Median Age (Male) |
|---|---|---|---|
| Wareham, Dorset | 49.4 yrs | 51.1 yrs | 47.3 yrs |
| United Kingdom | 39.6 yrs | 40.6 yrs | 38.5 yrs |
Wareham, Dorset Population Density
Population Density: 1,886 / km²
| Location | Population | Area | Density |
|---|---|---|---|
| Wareham, Dorset | 4,008 | 2.125 km² | 1,886 / km² |
| United Kingdom | 64.5 million | 247,916.6 km² | 260 / km² |
Wareham, Dorset Historical and Projected Population
Estimated Population from 0 to 2100
- JRC (European Commission's Joint Research Centre) work on the GHS built-up grid
- CIESIN (Center for International Earth Science Information Network)
- [Link] Klein Goldewijk, K., Beusen, A., Doelman, J., and Stehfest, E.: Anthropogenic land use estimates for the Holocene – HYDE 3.2, Earth Syst. Sci. Data, 9, 927–953, https://doi.org/10.5194/essd-9-927-2017, 2017.
Neighborhoods in Wareham, Dorset
Percentage of businesses by neighborhood in Wareham, Dorset
Price Distribution
Business distribution by price for Wareham, Dorset
Human Development Index (HDI)
Statistic composite index of life expectancy, education, and per capita income.
Wareham, Dorset CO2 Emissions
Carbon Dioxide (CO2) Emissions Per Capita in Tonnes Per Year
| Location | CO2 Emissions | CO2 Emissions Per Capita | CO2 Emissions Intensity |
|---|---|---|---|
| Wareham, Dorset | 54,227 tn | 13.53 tn | 25,518.6 tons/km² |
| United Kingdom | 735,672,544 tn | 11.4 tn | 2,967.4 tons/km² |
| 2013 CO2 emissions (tonnes/year) | 54,227 tn |
| 2013 CO2 emissions (tonnes/year) per capita | 13.53 tn |
| 2013 CO2 emissions intensity (tonnes/km²/year) | 25,518.6 tons/km² |
Natural Hazards Risk
Relative risk out of 10
| Hazard | Risk Level |
|---|---|
| Flood | Medium (7) |
* Risk, particularly concerning flood or landslide, may not be for the entire area.
- Dilley, M., R.S. Chen, U. Deichmann, A.L. Lerner-Lam, M. Arnold, J. Agwe, P. Buys, O. Kjekstad, B. Lyon, and G. Yetman. 2005. Natural Disaster Hotspots: A Global Risk Analysis. Washington, D.C.: World Bank. https://doi.org/10.1596/0-8213-5930-4.
- Center for Hazards and Risk Research - CHRR - Columbia University, Center for International Earth Science Information Network - CIESIN - Columbia University. 2005. Global Flood Hazard Frequency and Distribution. Palisades, NY: NASA Socioeconomic Data and Applications Center (SEDAC). https://doi.org/10.7927/H4668B3D.
Recent Nearby Earthquakes
Magnitude 3.0 and greater
| Date▼ | Time↕ | Magnitude↕ | Distance↕ | Depth↕ | Location↕ | Link |
|---|---|---|---|---|---|---|
| 5/19/19 | 9:51 AM | 3 | 21.6 km | 10,000 m | 7km ESE of Swanage, United Kingdom | usgs.gov |
| 1/29/04 | 8:23 PM | 3.7 | 75.7 km | 6,500 m | England, United Kingdom | usgs.gov |
| 1/29/04 | 10:56 AM | 3.6 | 75.7 km | 6,500 m | England, United Kingdom | usgs.gov |
| 1/29/04 | 10:56 AM | 3.3 | 75.7 km | 6,500 m | England, United Kingdom | usgs.gov |
| 10/16/97 | 12:19 AM | 3.2 | 99 km | 10,000 m | England, United Kingdom | usgs.gov |
| 9/9/95 | 6:20 PM | 3.3 | 87.3 km | 10,000 m | England, United Kingdom | usgs.gov |
| 11/26/91 | 6:57 PM | 3 | 68.4 km | 10,000 m | England, United Kingdom | usgs.gov |
| 10/23/88 | 3:01 AM | 3.1 | 82.9 km | 10,000 m | England, United Kingdom | usgs.gov |
| 4/3/84 | 2:27 PM | 3.8 | 39.6 km | 10,000 m | England, United Kingdom | usgs.gov |
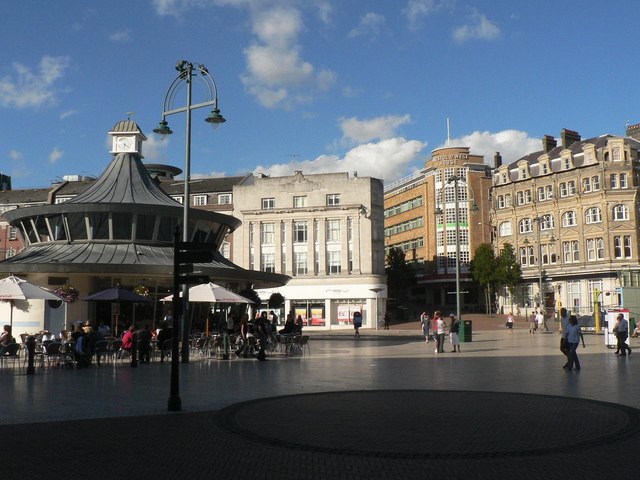
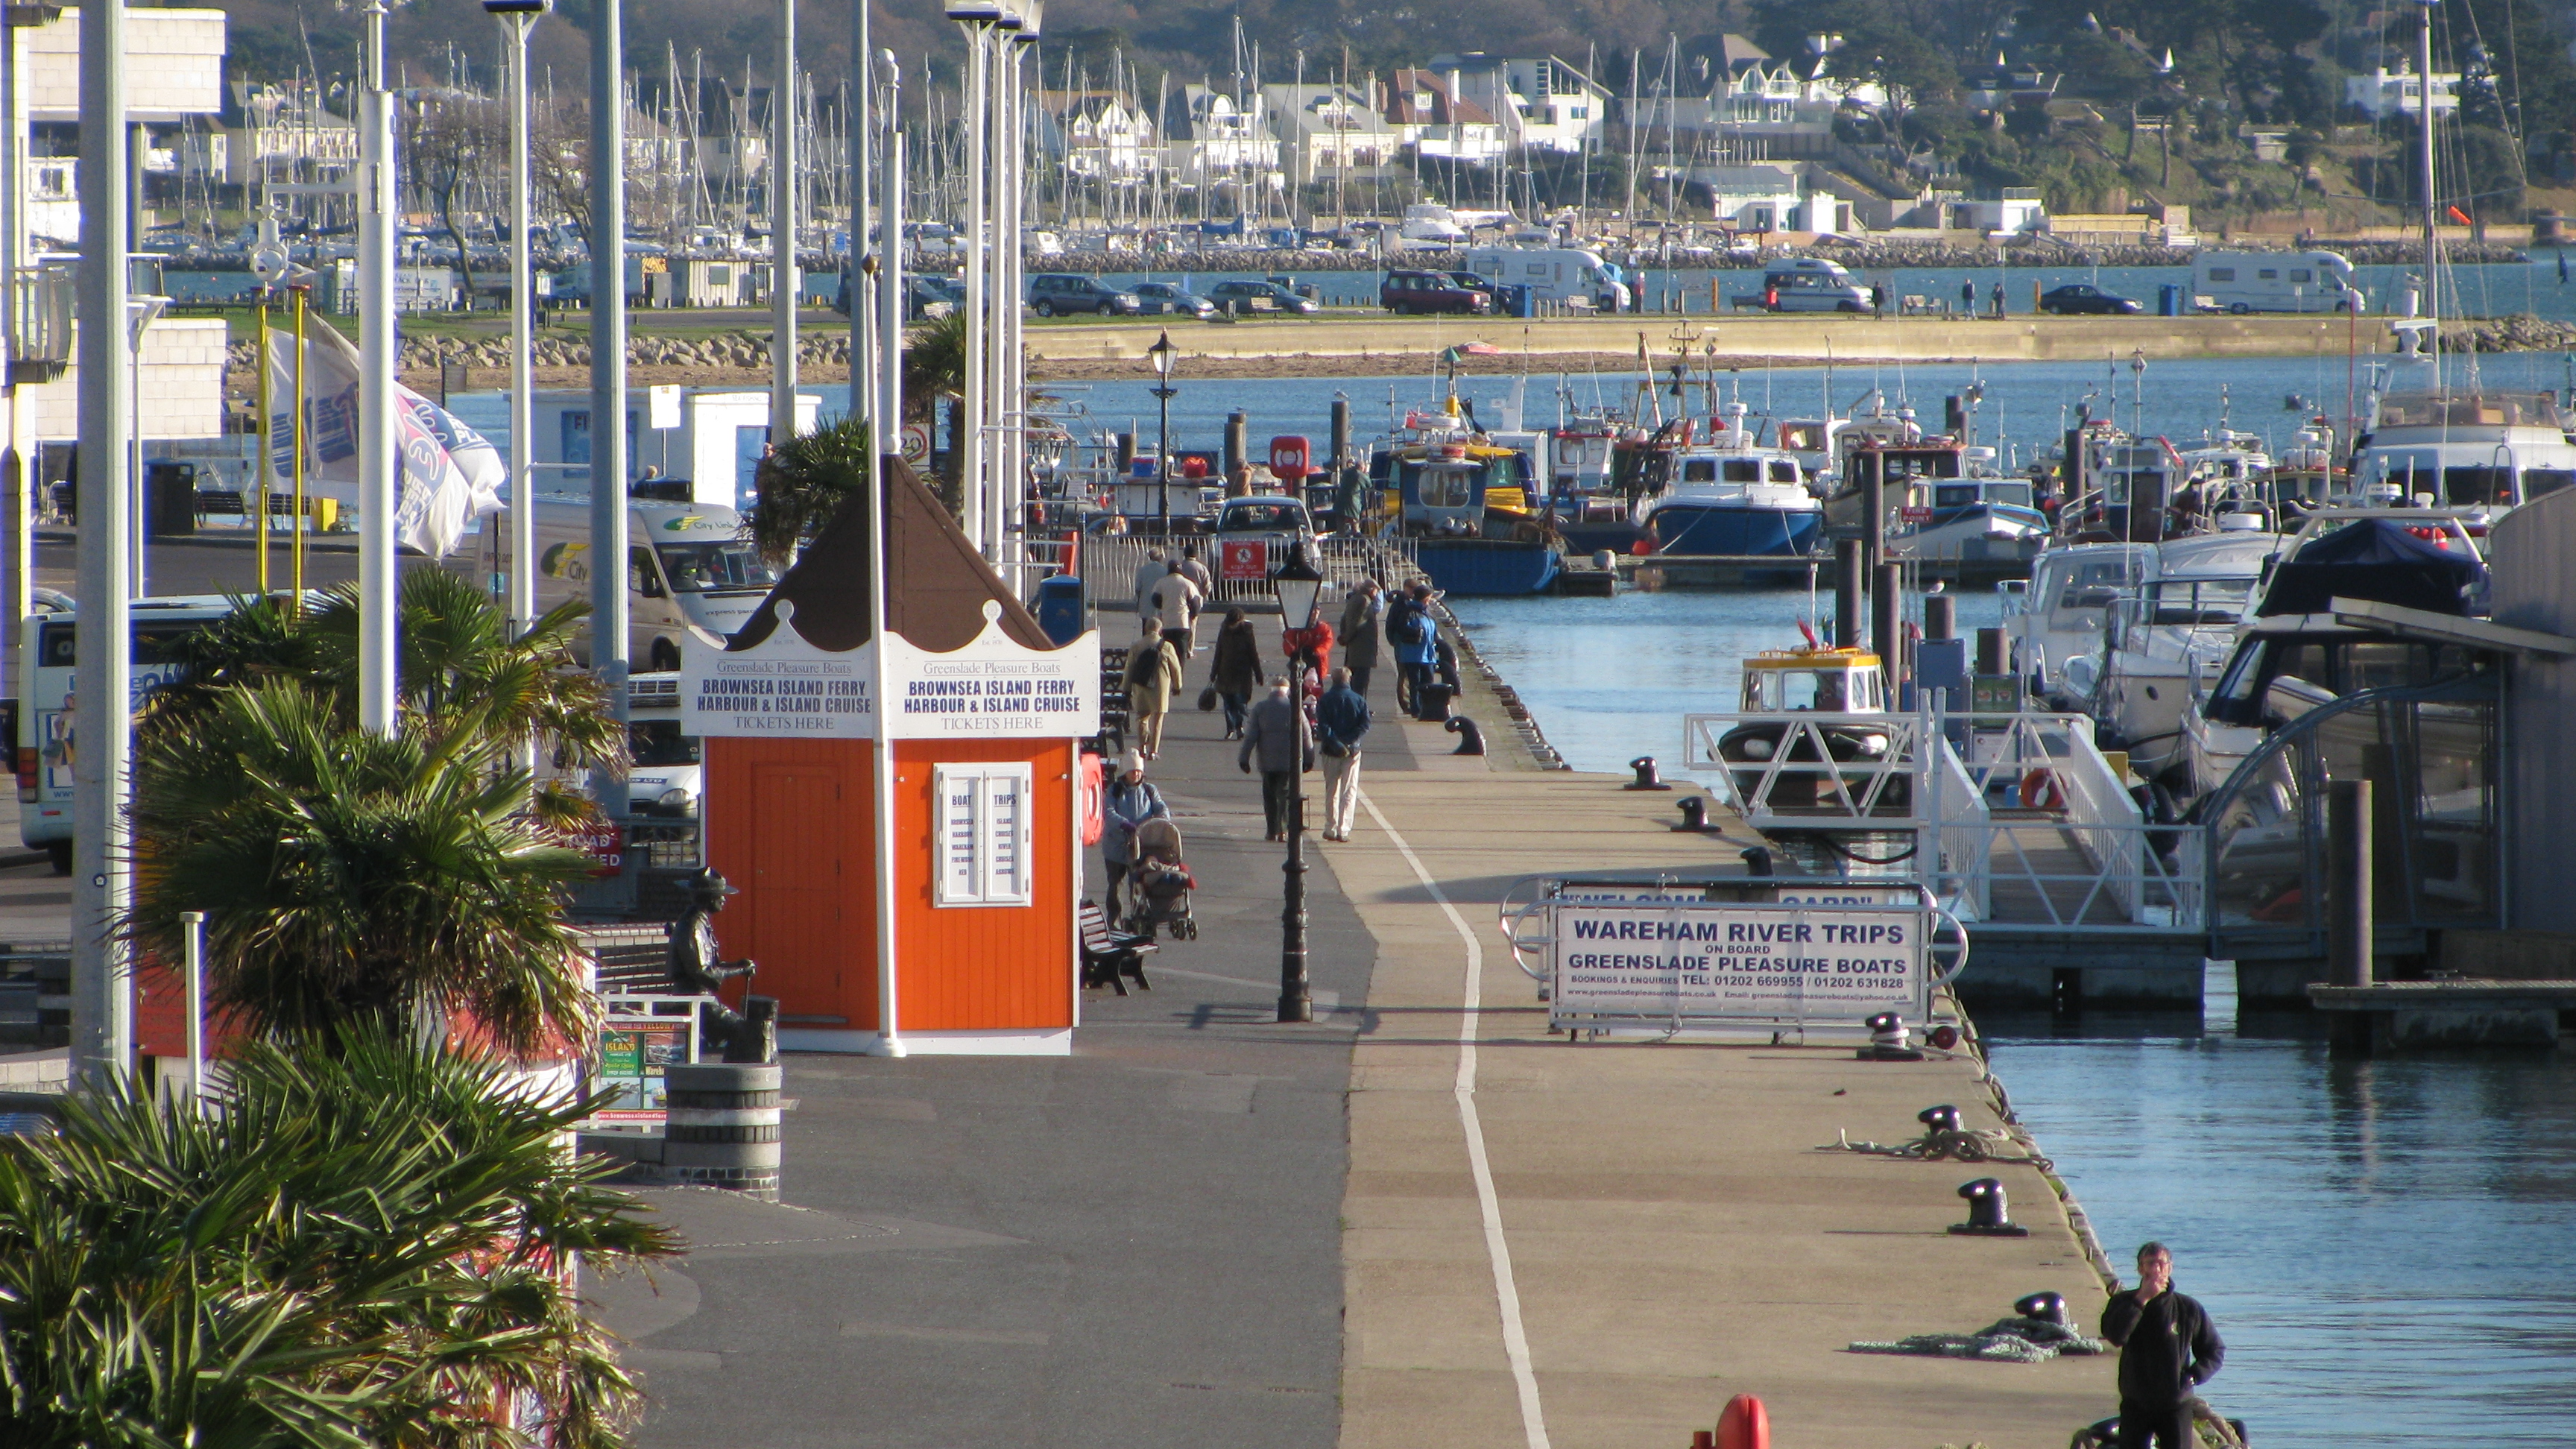
Wareham, Dorset
(/ˈwɛərəm/ WAIR-əm) is an historic market town and, under the name Wareham Town, a civil parish, in the English county of Dorset. The town is situated on the River Frome eight miles (13 km) southwest of Poole.
Wareham, Dorset Wikipedia Page
About Our Data
The data on this page is estimated using a number of publicly available tools and resources. It is provided without warranty, and could contain inaccuracies. Use at your own risk.