Categories in West Down, Devon
Industries
Business Distribution by Industry in West Down, Devon
| Industry Description | Number of Establishments | Average Age of Business |
|---|---|---|
| Shopping other | 20,121 | 20 years |
| Restaurants | 3,501 | 16 years |
| Corporate management | 3,320 | 17 years |
| Other construction | 3,046 | 17 years |
| Hospitals | 2,376 | — |
| Technical construction services | 2,327 | 24 years |
| Construction of buildings | 2,044 | 17 years |
| Specialized design | 1,961 | 16 years |
| Real estate | 1,935 | 17 years |
| Car repair | 1,765 | 16 years |
| Hairdressers | 1,759 | — |
| Shopping | 1,681 | 35 years |
| Accountants | 1,509 | 21 years |
| Electronics stores | 1,408 | 33 years |
| Electrical installation | 1,333 | 17 years |
| General contractors | 1,308 | 17 years |
| Wholesale of machinery | 1,263 | 23 years |
| Lawyers legal | 1,238 | 16 years |
West Down, Devon Facts
| Area | 16.8 km² |
| Population | 694 |
| Male Population | 326 (47.0%) |
| Female Population | 368 (53.0%) |
| Population change (1975 to 2020) | +16.1% |
| Population change (2000 to 2020) | +10.5% |
| Median Age | 46.9 years (Male: 47, Female: 46.9) |
| Neighborhoods | Merton |
| Local Time | |
| Timezone | British Summer Time |
| Lat & Lng | 51.16667, -4.11667 |
| Postal Codes | EX33, EX34 |
Map of West Down, Devon
Interactive Map
West Down, Devon Population
Years 1975 to 2020
| Data | 1975 | 1990 | 2000 | 2015 | 2020 |
|---|---|---|---|---|---|
| Population | 598 | 610 | 628 | 686 | 694 |
| Population Density | 35.6 / km² | 36.3 / km² | 37.4 / km² | 40.8 / km² | 41.3 / km² |
West Down, Devon Population change from 2000 to 2015
Increase of 9.2% from year 2000 to 2015
| Location | Change since 1975 | Change since 1990 | Change since 2000 |
|---|---|---|---|
| West Down, Devon | +14.7% | +12.5% | +9.2% |
| United Kingdom | +15.2% | +13.3% | +9.9% |
West Down, Devon Median Age
Median Age: 46.9 years
| Location | Median Age | Median Age (Female) | Median Age (Male) |
|---|---|---|---|
| West Down, Devon | 46.9 yrs | 46.9 yrs | 47 yrs |
| United Kingdom | 39.6 yrs | 40.6 yrs | 38.5 yrs |
West Down, Devon Population Density
Population Density: 41.3 / km²
| Location | Population | Area | Density |
|---|---|---|---|
| West Down, Devon | 694 | 16.8 km² | 41.3 / km² |
| United Kingdom | 64.5 million | 247,916.6 km² | 260 / km² |
West Down, Devon Historical and Projected Population
Estimated Population from 0 to 2100
- JRC (European Commission's Joint Research Centre) work on the GHS built-up grid
- CIESIN (Center for International Earth Science Information Network)
- [Link] Klein Goldewijk, K., Beusen, A., Doelman, J., and Stehfest, E.: Anthropogenic land use estimates for the Holocene – HYDE 3.2, Earth Syst. Sci. Data, 9, 927–953, https://doi.org/10.5194/essd-9-927-2017, 2017.
Area Codes
Percentage Area Codes used by businesses in West Down, Devon
Postal Codes
Percentage of businesses by Postal Codes in West Down, Devon
Price Distribution
Business distribution by price for West Down, Devon
Human Development Index (HDI)
Statistic composite index of life expectancy, education, and per capita income.
West Down, Devon CO2 Emissions
Carbon Dioxide (CO2) Emissions Per Capita in Tonnes Per Year
| Location | CO2 Emissions | CO2 Emissions Per Capita | CO2 Emissions Intensity |
|---|---|---|---|
| West Down, Devon | 8,348 tn | 12.03 tn | 496.5 tons/km² |
| United Kingdom | 735,672,544 tn | 11.4 tn | 2,967.4 tons/km² |
| 2013 CO2 emissions (tonnes/year) | 8,348 tn |
| 2013 CO2 emissions (tonnes/year) per capita | 12.03 tn |
| 2013 CO2 emissions intensity (tonnes/km²/year) | 496.5 tons/km² |
Natural Hazards Risk
Relative risk out of 10
| Hazard | Risk Level |
|---|---|
| Flood | Medium (7) |
* Risk, particularly concerning flood or landslide, may not be for the entire area.
- Dilley, M., R.S. Chen, U. Deichmann, A.L. Lerner-Lam, M. Arnold, J. Agwe, P. Buys, O. Kjekstad, B. Lyon, and G. Yetman. 2005. Natural Disaster Hotspots: A Global Risk Analysis. Washington, D.C.: World Bank. https://doi.org/10.1596/0-8213-5930-4.
- Center for Hazards and Risk Research - CHRR - Columbia University, Center for International Earth Science Information Network - CIESIN - Columbia University. 2005. Global Flood Hazard Frequency and Distribution. Palisades, NY: NASA Socioeconomic Data and Applications Center (SEDAC). https://doi.org/10.7927/H4668B3D.
Recent Nearby Earthquakes
Magnitude 3.0 and greater
| Date▼ | Time↕ | Magnitude↕ | Distance↕ | Depth↕ | Location↕ | Link |
|---|---|---|---|---|---|---|
| 2/17/18 | 2:31 PM | 4.3 | 64.5 km | 11,550 m | 5km NE of Clydach, United Kingdom | usgs.gov |
| 2/20/14 | 1:21 PM | 4.1 | 22.1 km | 3,000 m | 17km NNW of Ilfracombe, United Kingdom | usgs.gov |
| 1/29/04 | 8:23 PM | 3.7 | 80 km | 6,500 m | England, United Kingdom | usgs.gov |
| 1/29/04 | 10:56 AM | 3.6 | 80 km | 6,500 m | England, United Kingdom | usgs.gov |
| 1/29/04 | 10:56 AM | 3.3 | 80 km | 6,500 m | England, United Kingdom | usgs.gov |
| 6/20/02 | 5:26 PM | 3.4 | 84.8 km | 14,300 m | Wales-England region, United Kingdom | usgs.gov |
| 2/12/02 | 7:13 PM | 3.5 | 84.3 km | 8,300 m | Wales-England region, United Kingdom | usgs.gov |
| 1/28/02 | 12:30 AM | 3 | 85.3 km | 10,000 m | Wales-England region, United Kingdom | usgs.gov |
| 10/10/01 | 2:52 AM | 3.5 | 76.6 km | 10,000 m | Wales-England region, United Kingdom | usgs.gov |
| 5/31/01 | 11:42 PM | 4 | 44.1 km | 28,700 m | England, United Kingdom | usgs.gov |
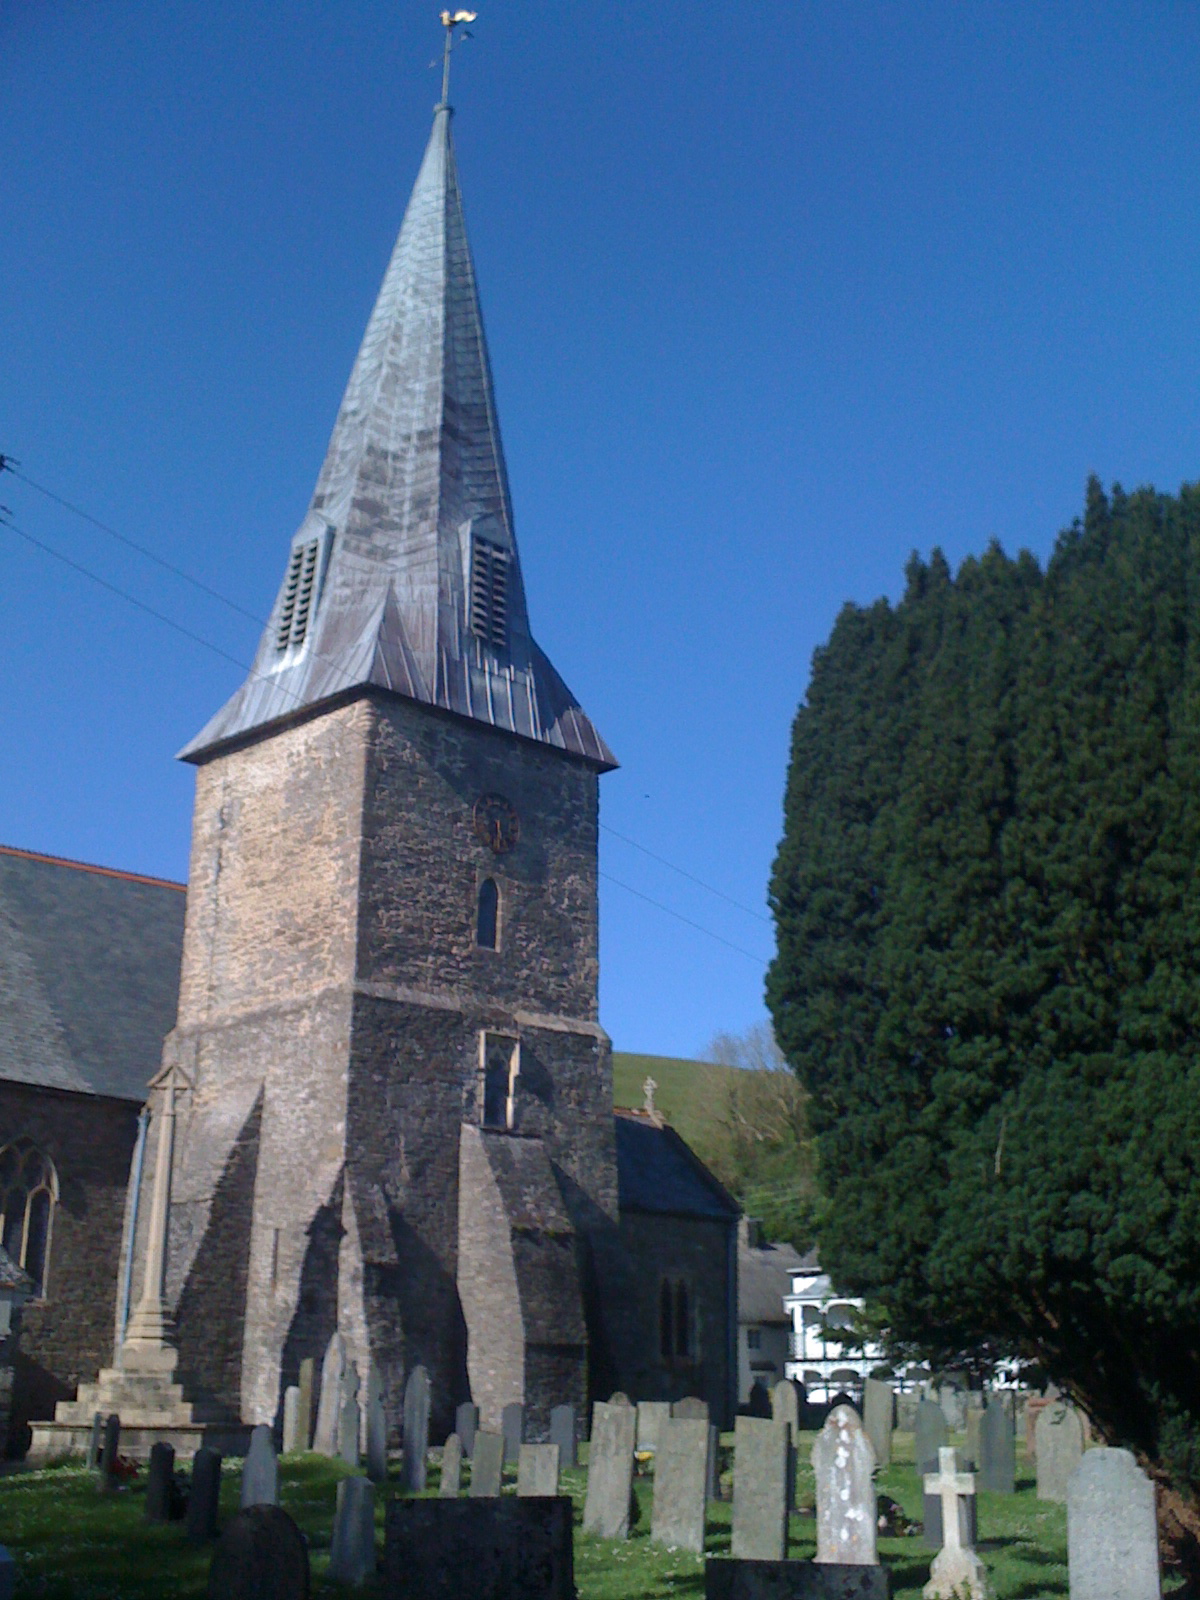
West Down, Devon
West Down is a small village on the route between Braunton and Ilfracombe and nine miles from Barnstaple in North Devon. The village sits in a bowl in the hills at 450 feet above sea level. It has a 14th-century church, and many of its older building..
West Down, Devon Wikipedia Page


About Our Data
The data on this page is estimated using a number of publicly available tools and resources. It is provided without warranty, and could contain inaccuracies. Use at your own risk.