Ambrolauri Facts
| Area | 1246.4 km² |
| Population | 10,185 |
| Male Population | 5,136 (50.4%) |
| Female Population | 5,049 (49.6%) |
| Population change (1975 to 2020) | -59.0% |
| Population change (2000 to 2020) | -40.7% |
| Median Age | 33.9 years (Male: 32.4, Female: 35.6) |
| Area Codes | 439 |
| Local Time | |
| Timezone | Georgia Standard Time |
| Lat & Lng | 42.52111, 43.16222 |
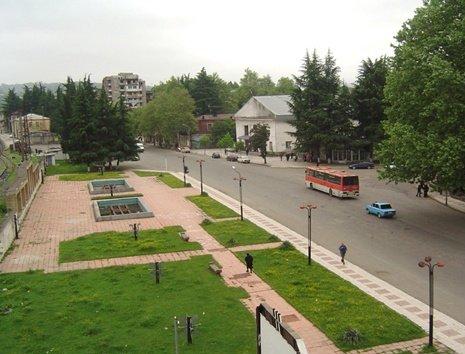
Map of Ambrolauri
Interactive Map
Ambrolauri Population
Years 1975 to 2020
| Data | 1975 | 1990 | 2000 | 2015 | 2020 |
|---|---|---|---|---|---|
| Population | 24,847 | 23,021 | 17,165 | 10,993 | 10,185 |
| Population Density | 19.9 / km² | 18.5 / km² | 13.8 / km² | 8.8 / km² | 8.2 / km² |
Ambrolauri Population change from 2000 to 2015
Decrease of 36% from year 2000 to 2015
| Location | Change since 1975 | Change since 1990 | Change since 2000 |
|---|---|---|---|
| Ambrolauri | -55.8% | -52.2% | -36% |
| Georgia (country) | -18.5% | -26.8% | -15.7% |
Ambrolauri Median Age
Median Age: 33.9 years
| Location | Median Age | Median Age (Female) | Median Age (Male) |
|---|---|---|---|
| Ambrolauri | 33.9 yrs | 35.6 yrs | 32.4 yrs |
| Georgia (country) | 33.9 yrs | 35.5 yrs | 32.4 yrs |
Ambrolauri Population Density
Population Density: 8.2 / km²
| Location | Population | Area | Density |
|---|---|---|---|
| Ambrolauri | 10,185 | 1,246.4 km² | 8.2 / km² |
| Georgia (country) | 4 million | 69,429.3 km² | 57.4 / km² |
Ambrolauri Historical and Projected Population
Estimated Population from 0 to 2100
- JRC (European Commission's Joint Research Centre) work on the GHS built-up grid
- CIESIN (Center for International Earth Science Information Network)
- [Link] Klein Goldewijk, K., Beusen, A., Doelman, J., and Stehfest, E.: Anthropogenic land use estimates for the Holocene – HYDE 3.2, Earth Syst. Sci. Data, 9, 927–953, https://doi.org/10.5194/essd-9-927-2017, 2017.
Human Development Index (HDI)
Statistic composite index of life expectancy, education, and per capita income.
Ambrolauri CO2 Emissions
Carbon Dioxide (CO2) Emissions Per Capita in Tonnes Per Year
| Location | CO2 Emissions | CO2 Emissions Per Capita | CO2 Emissions Intensity |
|---|---|---|---|
| Ambrolauri | 28,643 tn | 2.81 tn | 23 tons/km² |
| Georgia (country) | 11,940,990 tn | 2.99 tn | 172 tons/km² |
| 2013 CO2 emissions (tonnes/year) | 28,643 tn |
| 2013 CO2 emissions (tonnes/year) per capita | 2.81 tn |
| 2013 CO2 emissions intensity (tonnes/km²/year) | 23 tons/km² |
Natural Hazards Risk
Relative risk out of 10
| Hazard | Risk Level |
|---|---|
| Flood | Medium (4) |
| Earthquake | High (8) |
| Landslide | High (8) |
* Risk, particularly concerning flood or landslide, may not be for the entire area.
- Dilley, M., R.S. Chen, U. Deichmann, A.L. Lerner-Lam, M. Arnold, J. Agwe, P. Buys, O. Kjekstad, B. Lyon, and G. Yetman. 2005. Natural Disaster Hotspots: A Global Risk Analysis. Washington, D.C.: World Bank. https://doi.org/10.1596/0-8213-5930-4.
- Center for Hazards and Risk Research - CHRR - Columbia University, Center for International Earth Science Information Network - CIESIN - Columbia University, and Norwegian Geotechnical Institute - NGI. 2005. Global Landslide Hazard Distribution. Palisades, NY: NASA Socioeconomic Data and Applications Center (SEDAC). https://doi.org/10.7927/H4P848VZ.
- Center for Hazards and Risk Research - CHRR - Columbia University, Center for International Earth Science Information Network - CIESIN - Columbia University. 2005. Global Flood Hazard Frequency and Distribution. Palisades, NY: NASA Socioeconomic Data and Applications Center (SEDAC). https://doi.org/10.7927/H4668B3D.
- Center for Hazards and Risk Research - CHRR - Columbia University, Center for International Earth Science Information Network - CIESIN - Columbia University. 2005. Global Earthquake Hazard Distribution - Peak Ground Acceleration. Palisades, NY: NASA Socioeconomic Data and Applications Center (SEDAC). https://doi.org/10.7927/H4BZ63ZS.
Recent Nearby Earthquakes
Magnitude 3.0 and greater
| Date▼ | Time↕ | Magnitude↕ | Distance↕ | Depth↕ | Location↕ | Link |
|---|---|---|---|---|---|---|
| 11/6/18 | 1:17 AM | 5 | 35.7 km | 10,000 m | 13km ESE of Oni, Georgia | usgs.gov |
| 10/28/18 | 9:03 AM | 4.2 | 72.5 km | 10,970 m | 9km NE of Borjomi, Georgia | usgs.gov |
| 6/29/18 | 5:30 AM | 4.4 | 36.9 km | 10,000 m | 12km NE of K'ut'aisi, Georgia | usgs.gov |
| 3/13/17 | 2:25 AM | 4.4 | 39.1 km | 12,480 m | 22km SE of Oni, Georgia | usgs.gov |
| 11/18/15 | 1:17 AM | 4.1 | 19.4 km | 3,500 m | 3km NE of Tqibuli, Georgia | usgs.gov |
| 1/30/15 | 1:56 AM | 4 | 25.3 km | 10,510 m | 8km SE of Tqibuli, Georgia | usgs.gov |
| 10/8/14 | 12:36 PM | 4 | 23 km | 10,000 m | 9km ESE of Tqibuli, Georgia | usgs.gov |
| 8/18/11 | 11:57 AM | 4.8 | 20 km | 10,000 m | Georgia (Sak'art'velo) | usgs.gov |
| 1/19/11 | 9:51 AM | 4.1 | 71 km | 10,000 m | Georgia (Sak'art'velo) | usgs.gov |
| 4/12/10 | 2:43 AM | 4.1 | 22.9 km | 10,000 m | Georgia (Sak'art'velo) | usgs.gov |
Ambrolauri
Ambrolauri (Georgian: ამბროლაური) is a city in Georgia, located in the western part of the country, on both banks of the Rioni river, at the elevation of 550 m above sea level. It is a self-governing city. At the same time, the city serves as the sea..
Ambrolauri Wikipedia Page


About Our Data
The data on this page is estimated using a number of publicly available tools and resources. It is provided without warranty, and could contain inaccuracies. Use at your own risk.