Alluitsup Paa Facts
| Area | 2.8 km² |
| Population | 73 |
| Male Population | 41 (55.8%) |
| Female Population | 32 (44.2%) |
| Population change (1975 to 2015) | -66.2% |
| Population change (2000 to 2015) | -52.0% |
| Median Age | 44.6 years (Male: 45.7, Female: 42.8) |
| Local Time | |
| Timezone | Greenland Summer Time |
| Lat & Lng | 60.46266, -45.56951 |
| Postal Codes | 3919 |
Map of Alluitsup Paa
Interactive Map
Alluitsup Paa Population
Years 1975 to 2015
| Data | 1975 | 1990 | 2000 | 2015 |
|---|---|---|---|---|
| Population | 216 | 236 | 152 | 73 |
| Population Density | 76.8 / km² | 83.9 / km² | 54 / km² | 26 / km² |
Alluitsup Paa Population change from 2000 to 2015
Decrease of 52% from year 2000 to 2015
| Location | Change since 1975 | Change since 1990 | Change since 2000 |
|---|---|---|---|
| Alluitsup Paa | -66.2% | -69.1% | -52% |
| Kujalleq | +81.5% | -8.9% | -6.9% |
| Greenland | -6.7% | +16.2% | +0.2% |
Alluitsup Paa Median Age
Median Age: 44.6 years
| Location | Median Age | Median Age (Female) | Median Age (Male) |
|---|---|---|---|
| Alluitsup Paa | 44.6 yrs | 42.8 yrs | 45.7 yrs |
| Kujalleq | 37.9 yrs | 36 yrs | 39.5 yrs |
| Greenland | 33.6 yrs | 32.1 yrs | 35 yrs |
Alluitsup Paa Population Density
Population Density: 26 / km²
| Location | Population | Area | Density |
|---|---|---|---|
| Alluitsup Paa | 73 | 2.813 km² | 26 / km² |
| Kujalleq | 3,265 | 51,539.1 km² | 0.1 / km² |
| Greenland | 34,483 | 2,165,628.3 km² | 0 / km² |
Alluitsup Paa Historical and Projected Population
Estimated Population from 1000 to 2015
- JRC (European Commission's Joint Research Centre) work on the GHS built-up grid
- CIESIN (Center for International Earth Science Information Network)
- [Link] Klein Goldewijk, K., Beusen, A., Doelman, J., and Stehfest, E.: Anthropogenic land use estimates for the Holocene – HYDE 3.2, Earth Syst. Sci. Data, 9, 927–953, https://doi.org/10.5194/essd-9-927-2017, 2017.
Human Development Index (HDI)
Statistic composite index of life expectancy, education, and per capita income.
Alluitsup Paa CO2 Emissions
Carbon Dioxide (CO2) Emissions Per Capita in Tonnes Per Year
| Location | CO2 Emissions | CO2 Emissions Per Capita | CO2 Emissions Intensity |
|---|---|---|---|
| Alluitsup Paa | 758 tn | 10.38 tn | 269.5 tons/km² |
| Kujalleq | 75,804 tn | 23.22 tn | 1.5 tons/km² |
| Greenland | 813,754 tn | 23.6 tn | 0.4 tons/km² |
| 2013 CO2 emissions (tonnes/year) | 758 tn |
| 2013 CO2 emissions (tonnes/year) per capita | 10.38 tn |
| 2013 CO2 emissions intensity (tonnes/km²/year) | 269.5 tons/km² |
Recent Nearby Earthquakes
Magnitude 3.0 and greater
| Date▼ | Time↕ | Magnitude↕ | Distance↕ | Depth↕ | Location↕ | Link |
|---|---|---|---|---|---|---|
| 6/25/18 | 8:55 PM | 4 | 93.3 km | 10,590 m | 99km NE of Nanortalik, Greenland | usgs.gov |
| 9/26/15 | 4:51 AM | 4.7 | 83.6 km | 10,470 m | 88km NE of Nanortalik, Greenland | usgs.gov |
| 4/11/13 | 11:02 PM | 4.6 | 92.3 km | 11,300 m | 93km NE of Nanortalik, Greenland | usgs.gov |
| 1/21/13 | 6:15 PM | 4.5 | 94 km | 10,000 m | 94km NE of Nanortalik, Greenland | usgs.gov |
| 10/25/12 | 11:19 AM | 4.6 | 89.7 km | 10,000 m | western Greenland | usgs.gov |
| 8/16/06 | 9:18 AM | 4.3 | 56.7 km | 10,000 m | western Greenland | usgs.gov |
| 12/24/05 | 7:42 AM | 4.1 | 51 km | 10,000 m | western Greenland | usgs.gov |
| 12/22/05 | 2:21 AM | 4.4 | 60.7 km | 10,000 m | western Greenland | usgs.gov |
| 12/18/05 | 12:57 PM | 4.2 | 61.4 km | 10,000 m | western Greenland | usgs.gov |
| 11/8/98 | 9:22 PM | 4.3 | 77.7 km | 10,000 m | western Greenland | usgs.gov |
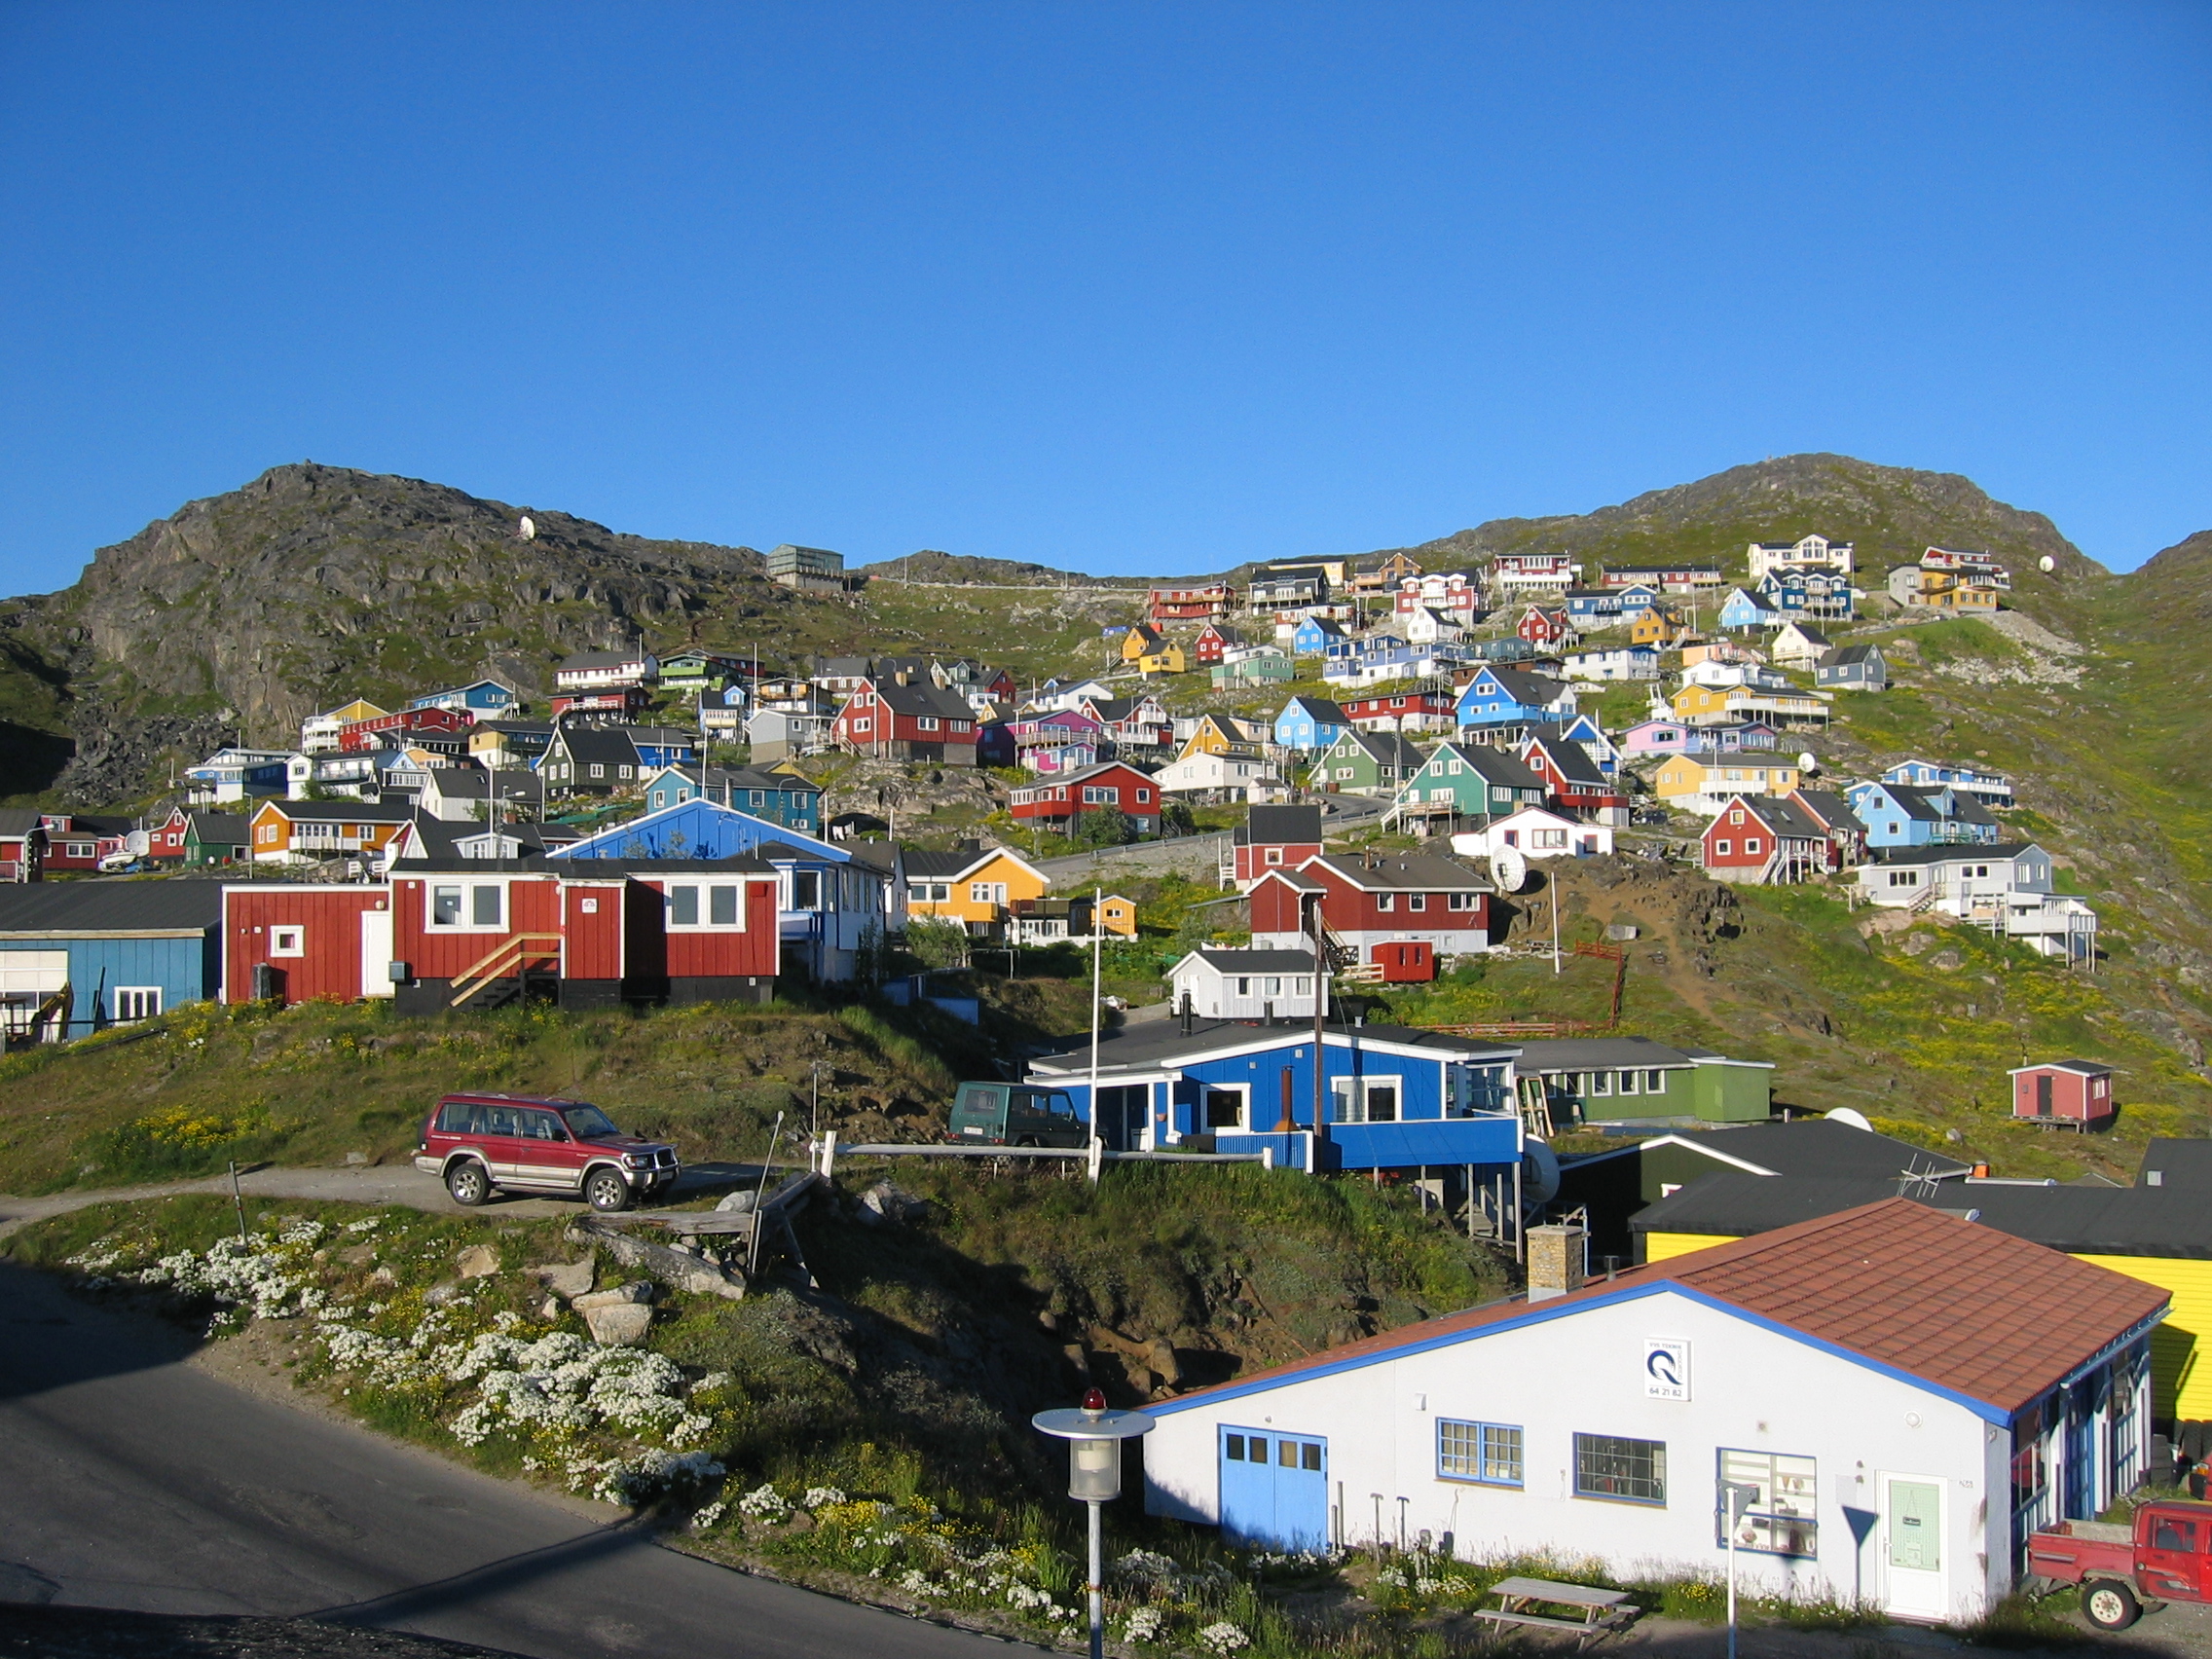
Alluitsup Paa
Alluitsup Paa (old spelling prior to the orthography reform in 1973: Agdluitsup pâ) is a village in the Kujalleq municipality in southern Greenland. Alluitsup Paa had 278 residents in 2012. Narsarsuaq, Alluitsup Paa is one of the rare settlements in..
Alluitsup Paa Wikipedia Page


About Our Data
The data on this page is estimated using a number of publicly available tools and resources. It is provided without warranty, and could contain inaccuracies. Use at your own risk.