Kapisillit Facts
| Area | 4.4 km² |
| Population | 55 |
| Male Population | 33 (59.3%) |
| Female Population | 22 (40.7%) |
| Population change (1975 to 2015) | -47.1% |
| Population change (2000 to 2015) | -43.3% |
| Median Age | 31.5 years (Male: 30, Female: 37.5) |
| Local Time | |
| Timezone | Greenland Summer Time |
| Lat & Lng | 64.43333, -50.26667 |
Map of Kapisillit
Interactive Map
Kapisillit Population
Years 1975 to 2015
| Data | 1975 | 1990 | 2000 | 2015 |
|---|---|---|---|---|
| Population | 104 | 135 | 97 | 55 |
| Population Density | 23.4 / km² | 30.4 / km² | 21.9 / km² | 12.4 / km² |
Kapisillit Population change from 2000 to 2015
Decrease of 43.3% from year 2000 to 2015
| Location | Change since 1975 | Change since 1990 | Change since 2000 |
|---|---|---|---|
| Kapisillit | -47.1% | -59.3% | -43.3% |
| Sermersooq | +364.8% | +155% | +9.2% |
| Greenland | -6.7% | +16.2% | +0.2% |
Kapisillit Median Age
Median Age: 31.5 years
| Location | Median Age | Median Age (Female) | Median Age (Male) |
|---|---|---|---|
| Kapisillit | 31.5 yrs | 37.5 yrs | 30 yrs |
| Sermersooq | 33.9 yrs | 32.6 yrs | 35.1 yrs |
| Greenland | 33.6 yrs | 32.1 yrs | 35 yrs |
Kapisillit Population Density
Population Density: 12.4 / km²
| Location | Population | Area | Density |
|---|---|---|---|
| Kapisillit | 55 | 4.438 km² | 12.4 / km² |
| Sermersooq | 11,370 | 546,450.6 km² | 0 / km² |
| Greenland | 34,483 | 2,165,628.3 km² | 0 / km² |
Kapisillit Historical and Projected Population
Estimated Population from 1000 to 2015
- JRC (European Commission's Joint Research Centre) work on the GHS built-up grid
- CIESIN (Center for International Earth Science Information Network)
- [Link] Klein Goldewijk, K., Beusen, A., Doelman, J., and Stehfest, E.: Anthropogenic land use estimates for the Holocene – HYDE 3.2, Earth Syst. Sci. Data, 9, 927–953, https://doi.org/10.5194/essd-9-927-2017, 2017.
Human Development Index (HDI)
Statistic composite index of life expectancy, education, and per capita income.
Sermersooq CO2 Emissions
Carbon Dioxide (CO2) Emissions Per Capita in Tonnes Per Year
| Location | CO2 Emissions | CO2 Emissions Per Capita | CO2 Emissions Intensity |
|---|---|---|---|
| Sermersooq | 272,342 tn | 23.95 tn | 0.5 tons/km² |
| Greenland | 813,754 tn | 23.6 tn | 0.4 tons/km² |
| 2013 CO2 emissions (tonnes/year) | 272,342 tn |
| 2013 CO2 emissions (tonnes/year) per capita | 23.95 tn |
| 2013 CO2 emissions intensity (tonnes/km²/year) | 0.5 tons/km² |
Recent Nearby Earthquakes
Magnitude 3.0 and greater
| Date▼ | Time↕ | Magnitude↕ | Distance↕ | Depth↕ | Location↕ | Link |
|---|---|---|---|---|---|---|
| 6/4/18 | 10:49 PM | 4.5 | 92.2 km | 10,000 m | 73km SE of Maniitsoq, Greenland | usgs.gov |
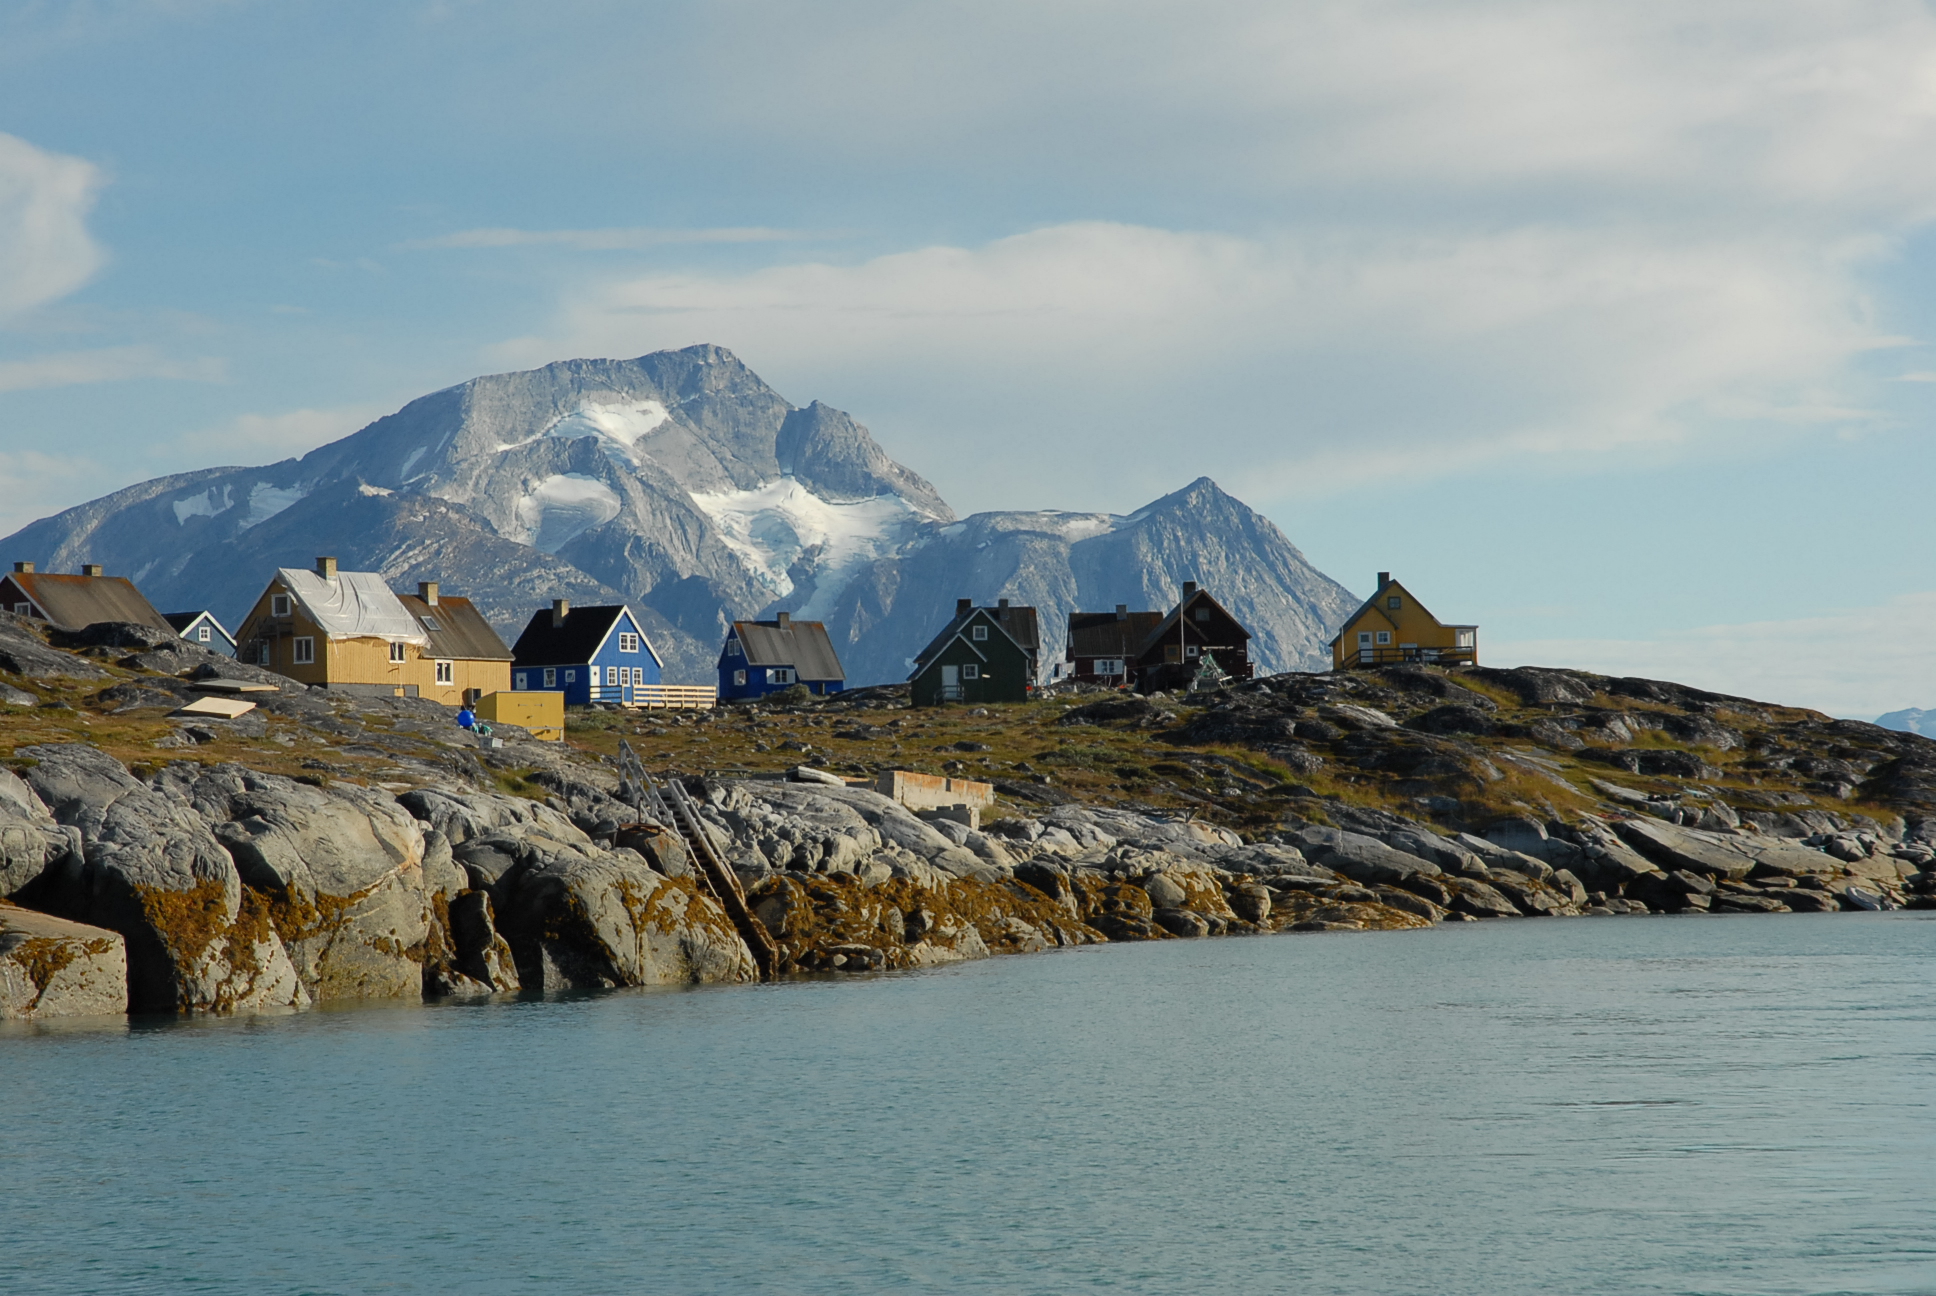
Kapisillit
Kapisillit is a settlement in the Sermersooq municipality in southwestern Greenland. In 2010, the settlement had 86 inhabitants. Kapisillit means the salmon in the Greenlandic language. The name refers to the belief that the only spawning-ground for ..
Kapisillit Wikipedia Page

About Our Data
The data on this page is estimated using a number of publicly available tools and resources. It is provided without warranty, and could contain inaccuracies. Use at your own risk.