Tiilerilaaq Facts
| Area | 3.6 km² |
| Population | 102 |
| Male Population | 55 (53.7%) |
| Female Population | 47 (46.3%) |
| Population change (1975 to 2015) | +61.9% |
| Population change (2000 to 2015) | -13.6% |
| Median Age | 32.2 years (Male: 33, Female: 31.2) |
| Local Time | |
| Timezone | Greenland Summer Time |
| Lat & Lng | 65.88873, -37.77870 |
Map of Tiilerilaaq
Interactive Map
Tiilerilaaq Population
Years 1975 to 2015
| Data | 1975 | 1990 | 2000 | 2015 |
|---|---|---|---|---|
| Population | 63 | 124 | 118 | 102 |
| Population Density | 17.7 / km² | 34.8 / km² | 33.1 / km² | 28.6 / km² |
Sources: JRC (European Commission's Joint Research Centre) work on the GHS built-up grid
Tiilerilaaq Population change from 2000 to 2015
Decrease of 13.6% from year 2000 to 2015
| Location | Change since 1975 | Change since 1990 | Change since 2000 |
|---|---|---|---|
| Tiilerilaaq | +61.9% | -17.7% | -13.6% |
| Sermersooq | +364.8% | +155% | +9.2% |
| Greenland | -6.7% | +16.2% | +0.2% |
Sources: JRC (European Commission's Joint Research Centre) work on the GHS built-up grid
Tiilerilaaq Median Age
Median Age: 32.2 years
| Location | Median Age | Median Age (Female) | Median Age (Male) |
|---|---|---|---|
| Tiilerilaaq | 32.2 yrs | 31.2 yrs | 33 yrs |
| Sermersooq | 33.9 yrs | 32.6 yrs | 35.1 yrs |
| Greenland | 33.6 yrs | 32.1 yrs | 35 yrs |
Sources: CIESIN (Center for International Earth Science Information Network)
Tiilerilaaq Population Density
Population Density: 28.6 / km²
| Location | Population | Area | Density |
|---|---|---|---|
| Tiilerilaaq | 102 | 3.563 km² | 28.6 / km² |
| Sermersooq | 11,370 | 546,450.6 km² | 0 / km² |
| Greenland | 34,483 | 2,165,628.3 km² | 0 / km² |
Sources: JRC (European Commission's Joint Research Centre) work on the GHS built-up grid
Tiilerilaaq Historical and Projected Population
Estimated Population from 1975 to 2015
Sources:
- JRC (European Commission's Joint Research Centre) work on the GHS built-up grid
- CIESIN (Center for International Earth Science Information Network)
- [Link] Klein Goldewijk, K., Beusen, A., Doelman, J., and Stehfest, E.: Anthropogenic land use estimates for the Holocene – HYDE 3.2, Earth Syst. Sci. Data, 9, 927–953, https://doi.org/10.5194/essd-9-927-2017, 2017.
Human Development Index (HDI)
Statistic composite index of life expectancy, education, and per capita income.
Source: [Link] Kummu, M., Taka, M. &Guillaume, J. Gridded global datasets for Gross Domestic Product and Human Development Index over 1990–2015. Sci Data 5, 180004 (2018) doi:10.1038/sdata.2018.4
Tiilerilaaq CO2 Emissions
Carbon Dioxide (CO2) Emissions Per Capita in Tonnes Per Year
| Location | CO2 Emissions | CO2 Emissions Per Capita | CO2 Emissions Intensity |
|---|---|---|---|
| Tiilerilaaq | 1,030 tn | 10.09 tn | 289 tons/km² |
| Sermersooq | 272,342 tn | 23.95 tn | 0.5 tons/km² |
| Greenland | 813,754 tn | 23.6 tn | 0.4 tons/km² |
Sources: [Link] Moran, D., Kanemoto K; Jiborn, M., Wood, R., Többen, J., and Seto, K.C. (2018) Carbon footprints of 13,000 cities. Environmental Research Letters DOI: 10.1088/1748-9326/aac72a
Tiilerilaaq CO2 Emissions
| 2013 CO2 emissions (tonnes/year) | 1,030 tn |
| 2013 CO2 emissions (tonnes/year) per capita | 10.09 tn |
| 2013 CO2 emissions intensity (tonnes/km²/year) | 289 tons/km² |
Recent Nearby Earthquakes
Magnitude 3.0 and greater
| Date▼ | Time↕ | Magnitude↕ | Distance↕ | Depth↕ | Location↕ | Link |
|---|---|---|---|---|---|---|
| 1/13/19 | 12:32 PM | 4.4 | 16.5 km | 10,000 m | 34km NNE of Tasiilaq, Greenland | usgs.gov |
| 4/25/08 | 7:39 AM | 4.1 | 22.7 km | 10,000 m | eastern Greenland | usgs.gov |
| 9/8/04 | 1:28 PM | 4.2 | 99.8 km | 10,000 m | eastern Greenland | usgs.gov |
| 5/1/93 | 12:01 PM | 4 | 61.9 km | 10,000 m | eastern Greenland | usgs.gov |
| 1/13/91 | 5:22 PM | 4.8 | 22.2 km | 10,000 m | eastern Greenland | usgs.gov |
Source: U.S. Geological Survey (USGS)
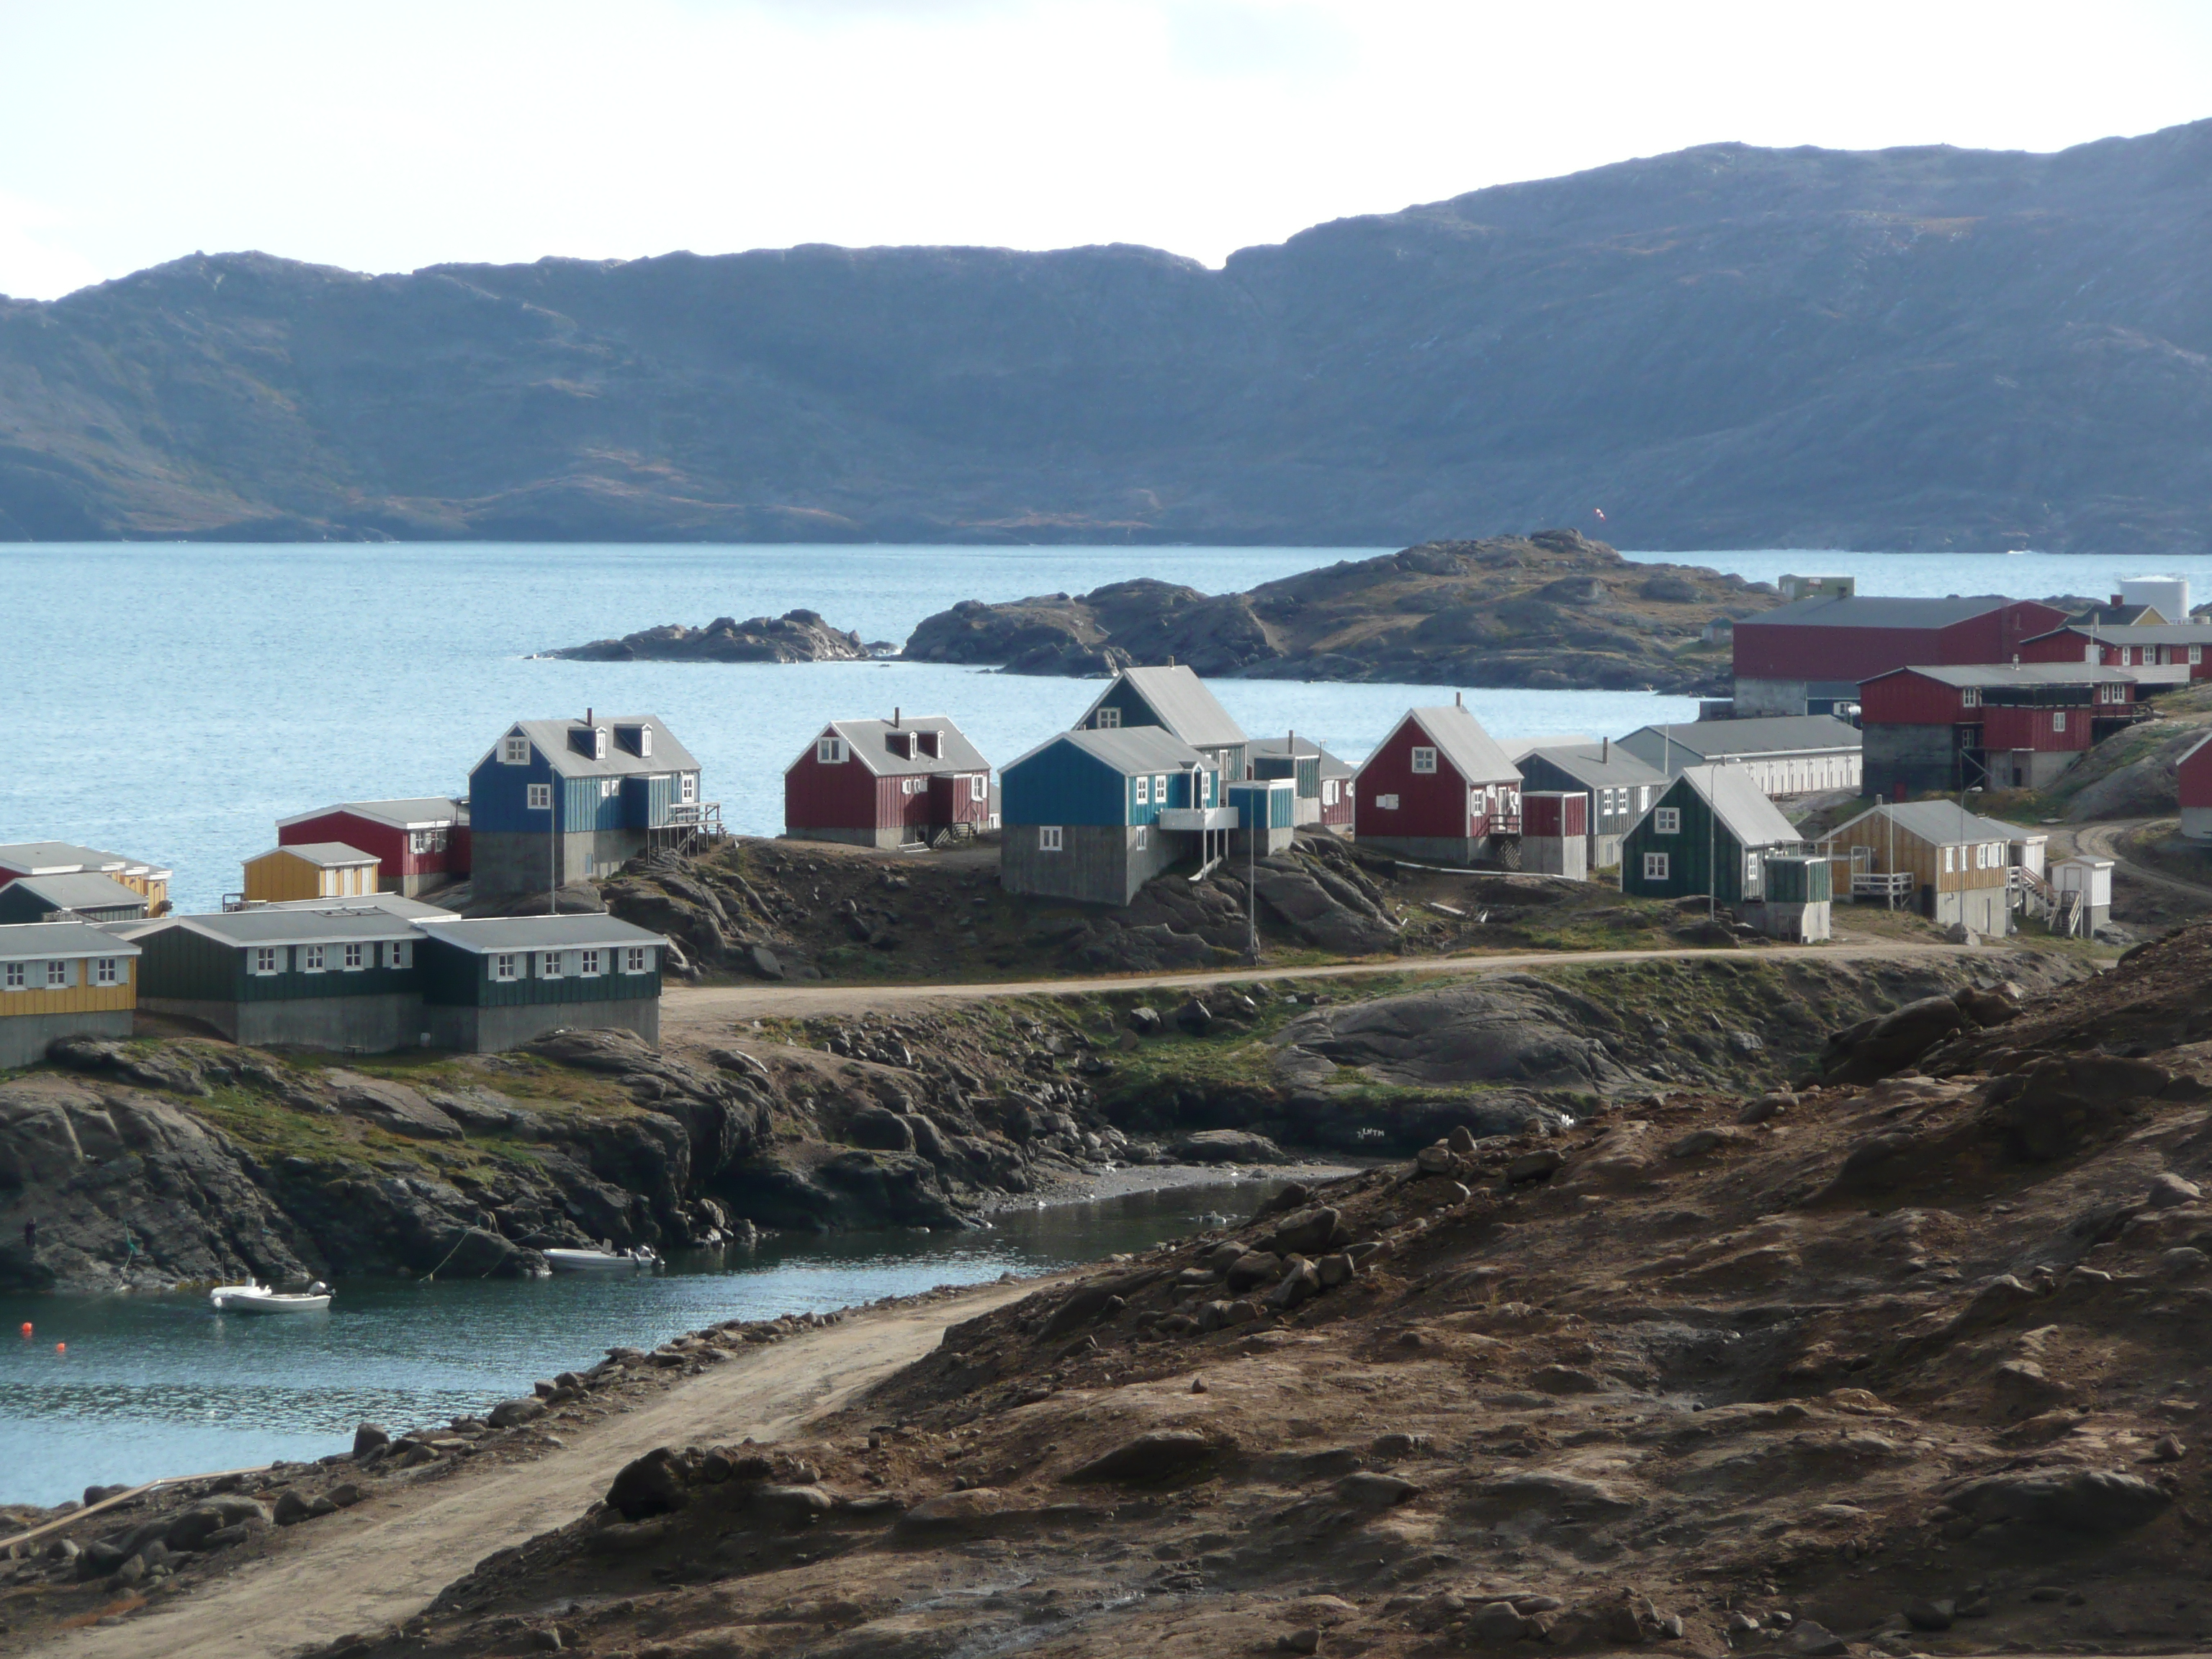
Tiilerilaaq
Tiilerilaaq (West Greenlandic: Tiniteqilaaq, old spelling: Tiniteqilâq) (IATA: TQI) is a settlement in the Sermersooq municipality, in southeastern Greenland. Its population was 134 in 2010.
Tiilerilaaq Wikipedia Page


About Our Data
The data on this page is estimated using a number of publicly available tools and resources. It is provided without warranty, and could contain inaccuracies. Use at your own risk.