Categories in Uummannaq
Uummannaq Facts
| Area | 5.6 km² |
| Population | 1,210 |
| Male Population | 646 (53.3%) |
| Female Population | 564 (46.7%) |
| Population change (1975 to 2020) | +43.0% |
| Population change (2000 to 2020) | -17.5% |
| Median Age | 33.7 years (Male: 34.6, Female: 32.8) |
| Area Codes | 95 |
| Local Time | |
| Timezone | Greenland Summer Time |
| Lat & Lng | 70.67472, -52.12639 |
| Postal Codes | 3961 |
Map of Uummannaq
Interactive Map
Uummannaq Population
Years 1975 to 2020
| Data | 1975 | 1990 | 2000 | 2015 | 2020 |
|---|---|---|---|---|---|
| Population | 846 | 1,593 | 1,466 | 1,210 | 1,210 |
| Population Density | 150.4 / km² | 283.2 / km² | 260.6 / km² | 215.1 / km² | 215.1 / km² |
Sources: JRC (European Commission's Joint Research Centre) work on the GHS built-up grid
Uummannaq Population change from 2000 to 2015
Decrease of 17.5% from year 2000 to 2015
| Location | Change since 1975 | Change since 1990 | Change since 2000 |
|---|---|---|---|
| Uummannaq | +43% | -24% | -17.5% |
| Qaasuitsup | -58.8% | -14% | -7.8% |
| Greenland | -6.7% | +16.2% | +0.2% |
Sources: JRC (European Commission's Joint Research Centre) work on the GHS built-up grid
Uummannaq Median Age
Median Age: 33.7 years
| Location | Median Age | Median Age (Female) | Median Age (Male) |
|---|---|---|---|
| Uummannaq | 33.7 yrs | 32.8 yrs | 34.6 yrs |
| Qaasuitsup | 32.9 yrs | 31 yrs | 34.6 yrs |
| Greenland | 33.6 yrs | 32.1 yrs | 35 yrs |
Sources: CIESIN (Center for International Earth Science Information Network)
Uummannaq Population Density
Population Density: 215 / km²
| Location | Population | Area | Density |
|---|---|---|---|
| Uummannaq | 1,210 | 5.6 km² | 215 / km² |
| Qaasuitsup | 12,104 | 576,067.4 km² | 0 / km² |
| Greenland | 34,483 | 2,165,628.3 km² | 0 / km² |
Sources: JRC (European Commission's Joint Research Centre) work on the GHS built-up grid
Uummannaq Historical and Projected Population
Estimated Population from 1975 to 2100
Sources:
- JRC (European Commission's Joint Research Centre) work on the GHS built-up grid
- CIESIN (Center for International Earth Science Information Network)
- [Link] Klein Goldewijk, K., Beusen, A., Doelman, J., and Stehfest, E.: Anthropogenic land use estimates for the Holocene – HYDE 3.2, Earth Syst. Sci. Data, 9, 927–953, https://doi.org/10.5194/essd-9-927-2017, 2017.
Human Development Index (HDI)
Statistic composite index of life expectancy, education, and per capita income.
Source: [Link] Kummu, M., Taka, M. &Guillaume, J. Gridded global datasets for Gross Domestic Product and Human Development Index over 1990–2015. Sci Data 5, 180004 (2018) doi:10.1038/sdata.2018.4
Qaasuitsup CO2 Emissions
Carbon Dioxide (CO2) Emissions Per Capita in Tonnes Per Year
| Location | CO2 Emissions | CO2 Emissions Per Capita | CO2 Emissions Intensity |
|---|---|---|---|
| Qaasuitsup | 290,830 tn | 24.03 tn | 0.5 tons/km² |
| Greenland | 813,754 tn | 23.6 tn | 0.4 tons/km² |
Sources: [Link] Moran, D., Kanemoto K; Jiborn, M., Wood, R., Többen, J., and Seto, K.C. (2018) Carbon footprints of 13,000 cities. Environmental Research Letters DOI: 10.1088/1748-9326/aac72a
Qaasuitsup CO2 Emissions
| 2013 CO2 emissions (tonnes/year) | 290,830 tn |
| 2013 CO2 emissions (tonnes/year) per capita | 24.03 tn |
| 2013 CO2 emissions intensity (tonnes/km²/year) | 0.5 tons/km² |
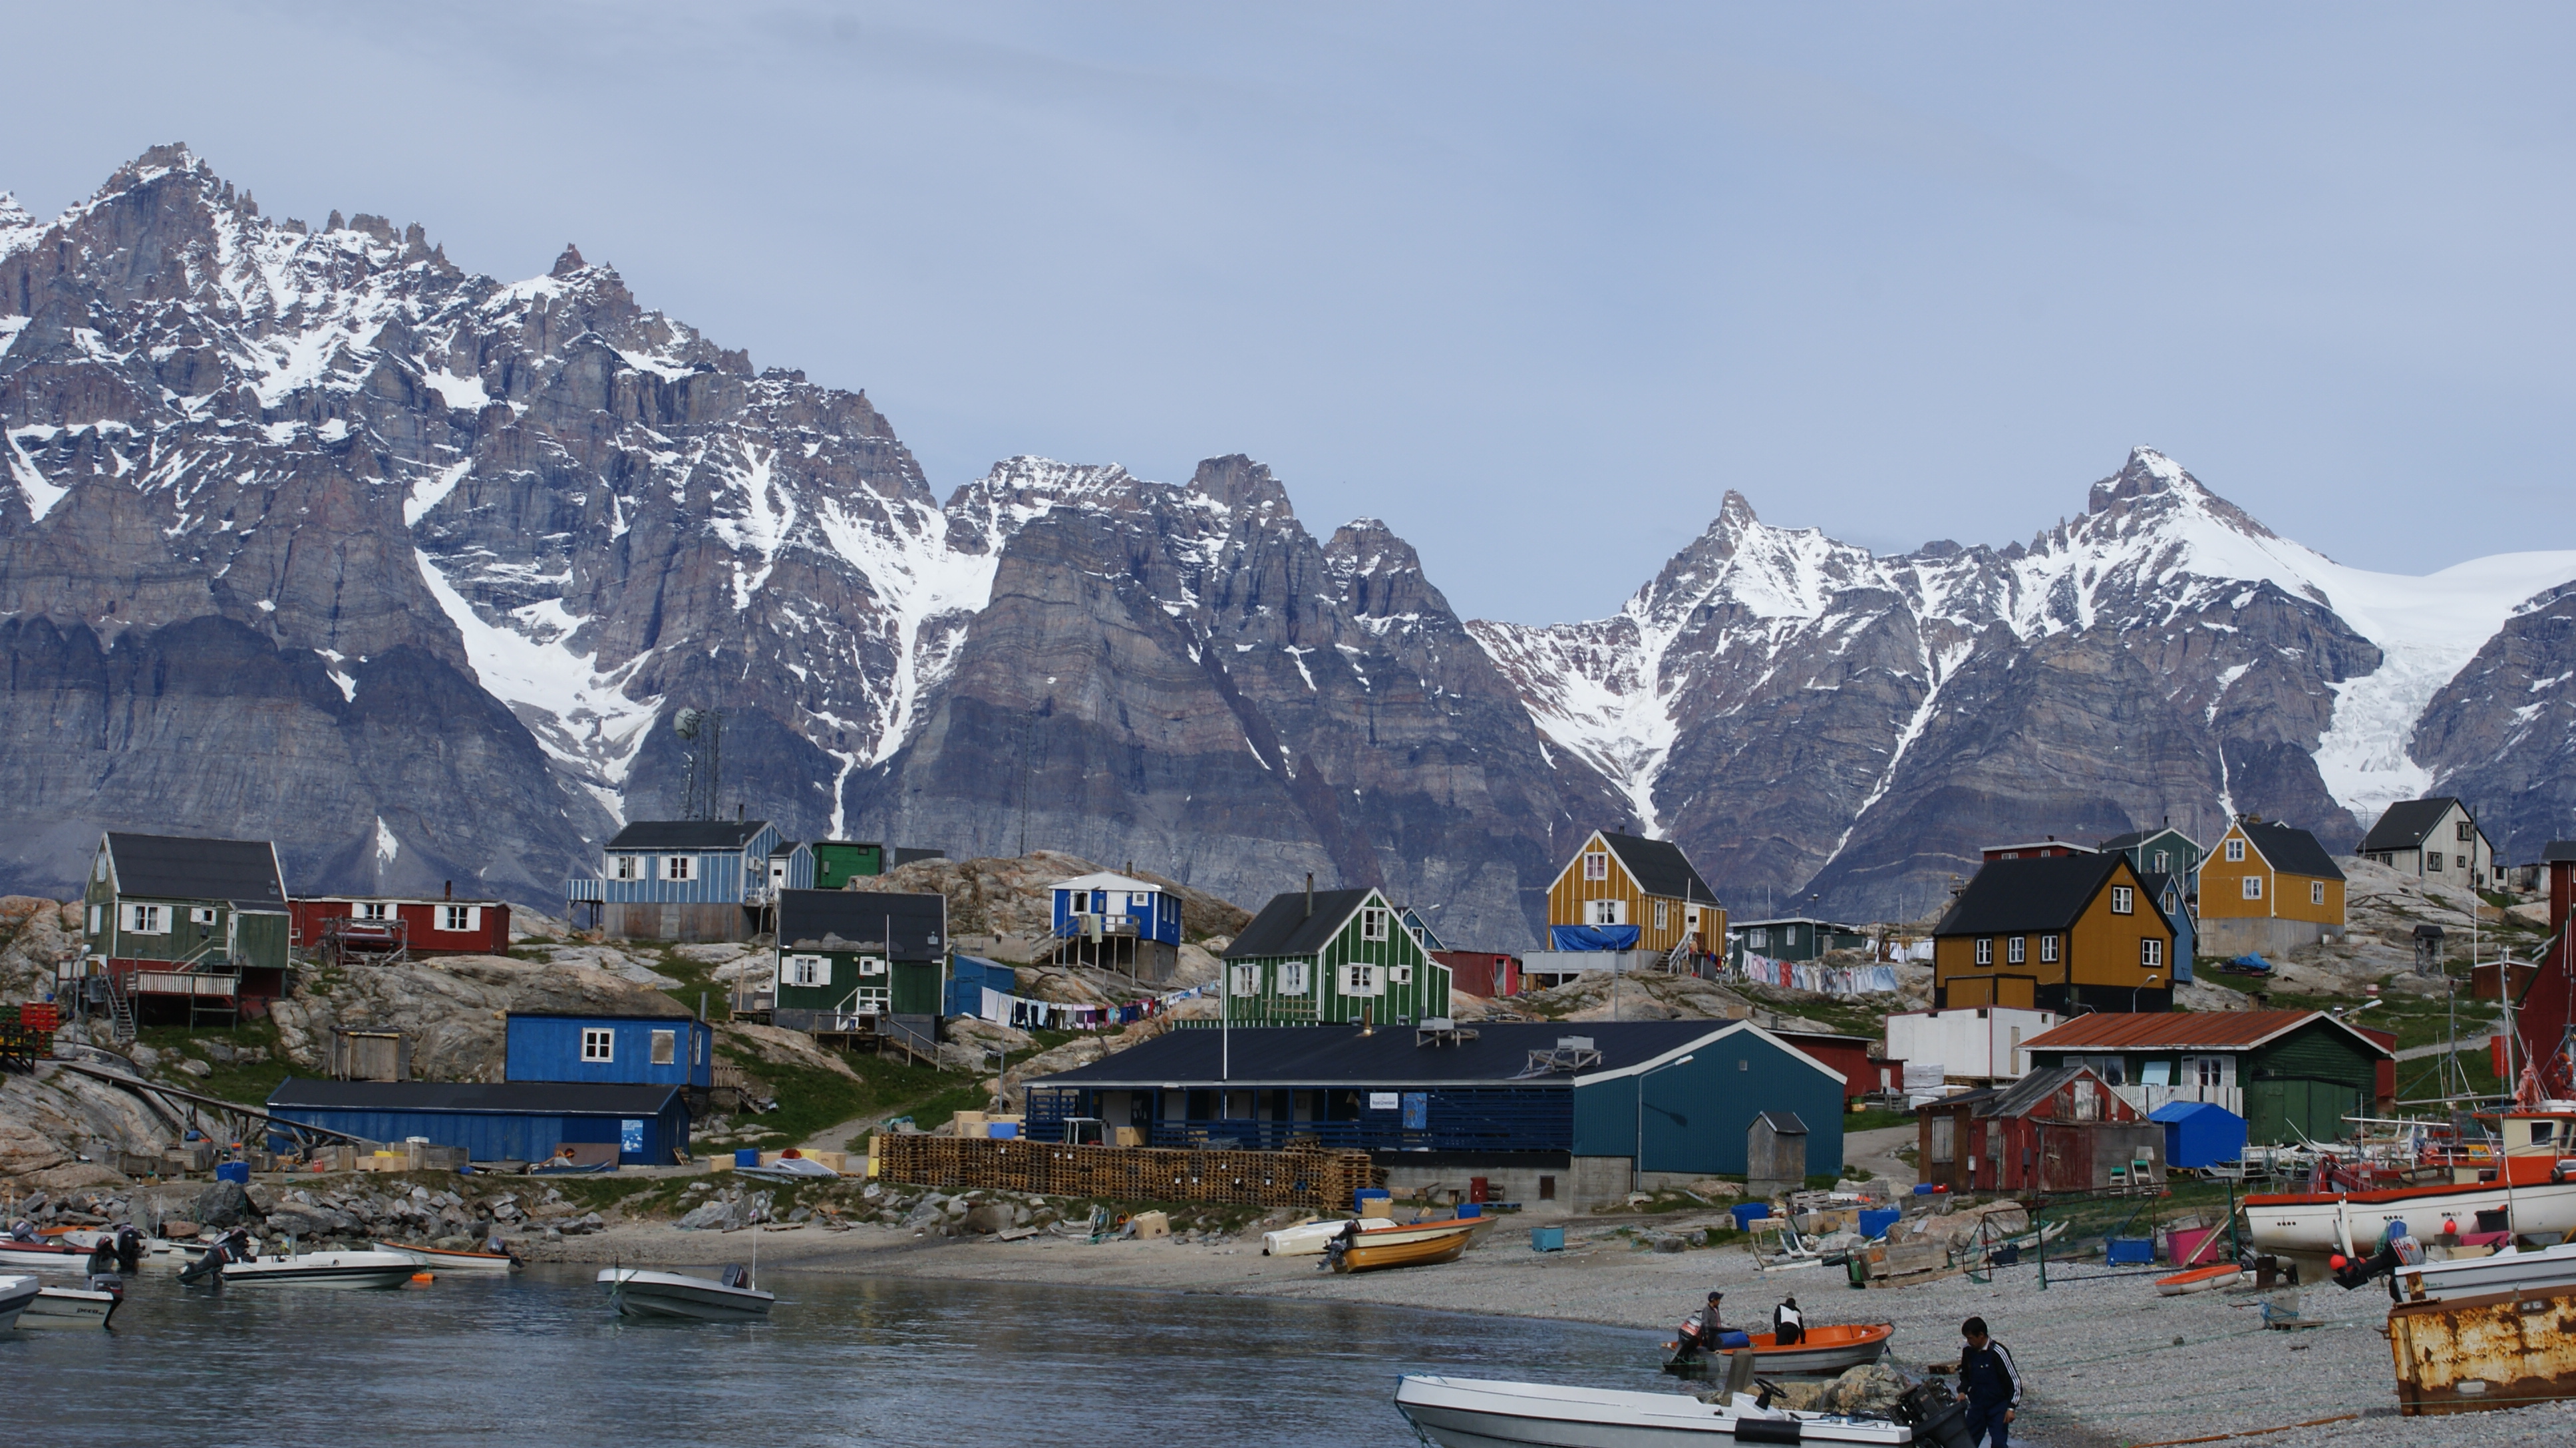
Uummannaq
Uummannaq is a town in the Qaasuitsup municipality, in northwestern Greenland. With 1,282 inhabitants in 2013, it is the eleventh-largest town in Greenland, and is home to the country's most northerly ferry terminal. Founded in 1763 as Ûmañak, the to..
Uummannaq Wikipedia Page


About Our Data
The data on this page is estimated using a number of publicly available tools and resources. It is provided without warranty, and could contain inaccuracies. Use at your own risk.