Categories in Davleia
Industries
Business Distribution by Industry in Davleia
Davleia Facts
| Area | 2.6 km² |
| Population | 1,151 |
| Male Population | 573 (49.8%) |
| Female Population | 578 (50.2%) |
| Population change (1975 to 2020) | +9.4% |
| Population change (2000 to 2020) | -6.6% |
| Median Age | 43 years (Male: 41.8, Female: 44.2) |
| Local Time | |
| Timezone | Eastern European Summer Time |
| Lat & Lng | 38.51462, 22.73315 |
| Postal Codes | 320 08 |
Map of Davleia
Interactive Map
Davleia Population
Years 1975 to 2020
| Data | 1975 | 1990 | 2000 | 2015 | 2020 |
|---|---|---|---|---|---|
| Population | 1,052 | 1,162 | 1,232 | 1,181 | 1,151 |
| Population Density | 400.8 / km² | 442.7 / km² | 469.3 / km² | 449.9 / km² | 438.5 / km² |
Davleia Population change from 2000 to 2015
Decrease of 4.1% from year 2000 to 2015
| Location | Change since 1975 | Change since 1990 | Change since 2000 |
|---|---|---|---|
| Davleia | +12.3% | +1.6% | -4.1% |
| Central Greece (region) | +18.1% | +6.2% | -1.2% |
| Greece | +21.3% | +8.1% | +0% |
Davleia Median Age
Median Age: 43 years
| Location | Median Age | Median Age (Female) | Median Age (Male) |
|---|---|---|---|
| Davleia | 43 yrs | 44.2 yrs | 41.8 yrs |
| Central Greece (region) | 43.5 yrs | 45.2 yrs | 41.9 yrs |
| Greece | 41.8 yrs | 43.1 yrs | 40.5 yrs |
Davleia Population Density
Population Density: 439 / km²
| Location | Population | Area | Density |
|---|---|---|---|
| Davleia | 1,151 | 2.625 km² | 439 / km² |
| Central Greece (region) | 534,502 | 15,673.8 km² | 34.1 / km² |
| Greece | 10.7 million | 132,689.5 km² | 80.4 / km² |
Davleia Historical and Projected Population
Estimated Population from 0 to 2100
- JRC (European Commission's Joint Research Centre) work on the GHS built-up grid
- CIESIN (Center for International Earth Science Information Network)
- [Link] Klein Goldewijk, K., Beusen, A., Doelman, J., and Stehfest, E.: Anthropogenic land use estimates for the Holocene – HYDE 3.2, Earth Syst. Sci. Data, 9, 927–953, https://doi.org/10.5194/essd-9-927-2017, 2017.
Human Development Index (HDI)
Statistic composite index of life expectancy, education, and per capita income.
Davleia CO2 Emissions
Carbon Dioxide (CO2) Emissions Per Capita in Tonnes Per Year
| Location | CO2 Emissions | CO2 Emissions Per Capita | CO2 Emissions Intensity |
|---|---|---|---|
| Davleia | 12,956 tn | 11.26 tn | 4,935.6 tons/km² |
| Central Greece (region) | 5,674,960 tn | 10.62 tn | 362.1 tons/km² |
| Greece | 105,407,278 tn | 9.89 tn | 794.4 tons/km² |
| 2013 CO2 emissions (tonnes/year) | 12,956 tn |
| 2013 CO2 emissions (tonnes/year) per capita | 11.26 tn |
| 2013 CO2 emissions intensity (tonnes/km²/year) | 4,935.6 tons/km² |
Natural Hazards Risk
Relative risk out of 10
| Hazard | Risk Level |
|---|---|
| Drought | Medium (7) |
| Earthquake | Medium (7) |
* Risk, particularly concerning flood or landslide, may not be for the entire area.
- Dilley, M., R.S. Chen, U. Deichmann, A.L. Lerner-Lam, M. Arnold, J. Agwe, P. Buys, O. Kjekstad, B. Lyon, and G. Yetman. 2005. Natural Disaster Hotspots: A Global Risk Analysis. Washington, D.C.: World Bank. https://doi.org/10.1596/0-8213-5930-4.
- Center for Hazards and Risk Research - CHRR - Columbia University, Center for International Earth Science Information Network - CIESIN - Columbia University, and International Research Institute for Climate and Society - IRI - Columbia University. 2005. Global Drought Hazard Frequency and Distribution. Palisades, NY: NASA Socioeconomic Data and Applications Center (SEDAC). https://doi.org/10.7927/H4VX0DFT.
- Center for Hazards and Risk Research - CHRR - Columbia University, Center for International Earth Science Information Network - CIESIN - Columbia University. 2005. Global Earthquake Hazard Distribution - Peak Ground Acceleration. Palisades, NY: NASA Socioeconomic Data and Applications Center (SEDAC). https://doi.org/10.7927/H4BZ63ZS.
Recent Nearby Earthquakes
Magnitude 3.0 and greater
| Date▼ | Time↕ | Magnitude↕ | Distance↕ | Depth↕ | Location↕ | Link |
|---|---|---|---|---|---|---|
| 7/9/18 | 12:58 AM | 3.9 | 23.9 km | 109,180 m | 6km SW of Kiriakion, Greece | usgs.gov |
| 5/22/16 | 6:25 AM | 4 | 19 km | 15,620 m | 9km WSW of Atalanti, Greece | usgs.gov |
| 5/23/15 | 8:45 AM | 4.2 | 17.9 km | 1,800 m | 6km NW of Elatia, Greece | usgs.gov |
| 4/28/14 | 3:49 AM | 4 | 21.9 km | 5,000 m | 8km NNE of Elatia, Greece | usgs.gov |
| 2/6/14 | 7:58 AM | 4.5 | 22.9 km | 12,400 m | 6km SSW of Kamena Vourla, Greece | usgs.gov |
| 2/1/14 | 8:14 AM | 4.7 | 20.4 km | 18,200 m | 7km NNW of Elatia, Greece | usgs.gov |
| 9/17/13 | 7:39 AM | 4.2 | 22.2 km | 8,000 m | 8km SSW of Kamena Vourla, Greece | usgs.gov |
| 9/16/13 | 3:01 PM | 5.3 | 21.3 km | 7,700 m | 8km NNW of Elatia, Greece | usgs.gov |
| 9/16/13 | 2:42 PM | 4.8 | 20.6 km | 0 m | 8km NNW of Elatia, Greece | usgs.gov |
| 8/18/13 | 10:16 PM | 4.4 | 21.3 km | 3,700 m | 9km NW of Elatia, Greece | usgs.gov |
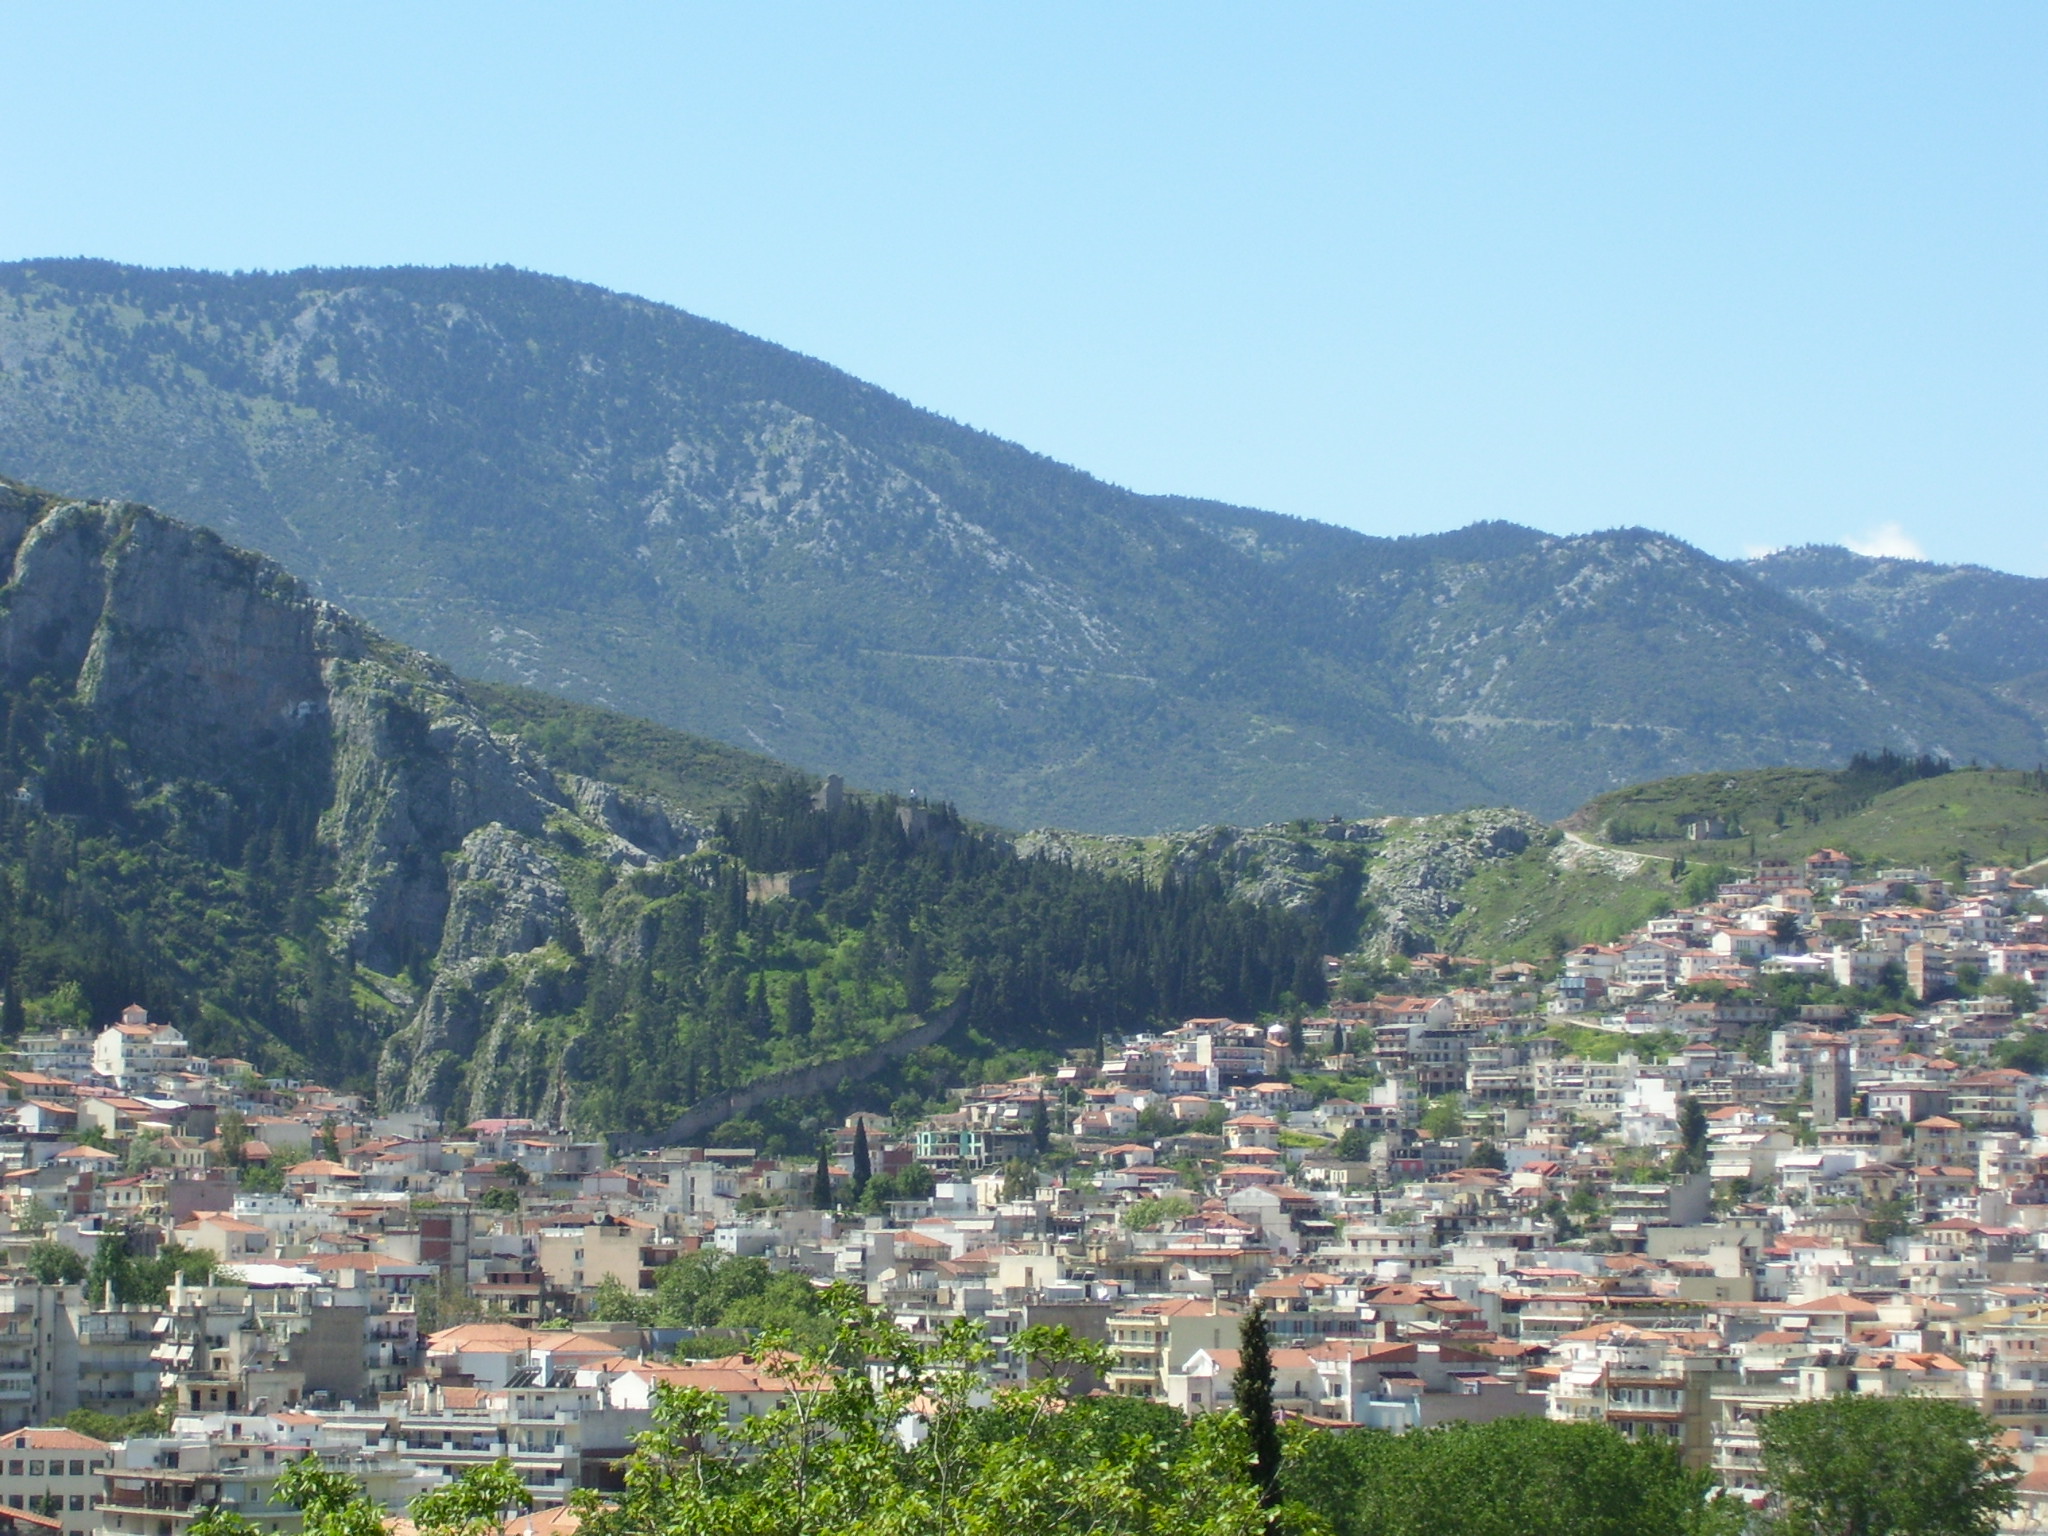
Davleia
Davleia (Greek: Δαύλεια) is a village and a former municipality in Boeotia, Greece. Since the 2011 local government reform it is part of the municipality Livadeia, of which it is a municipal unit. Its name comes from the ancient settlement Daulis. Th..
Davleia Wikipedia Page


About Our Data
The data on this page is estimated using a number of publicly available tools and resources. It is provided without warranty, and could contain inaccuracies. Use at your own risk.