Comapa Facts
| Area | 145.6 km² |
| Population | 30,495 |
| Male Population | 14,111 (46.3%) |
| Female Population | 16,384 (53.7%) |
| Population change (1975 to 2020) | +173.3% |
| Population change (2000 to 2020) | +51.1% |
| Median Age | 18.7 years (Male: 17.9, Female: 19.5) |
| Local Time | |
| Timezone | Central Standard Time |
| Lat & Lng | 14.11667, -89.91667 |
| Postal Codes | 22011 |
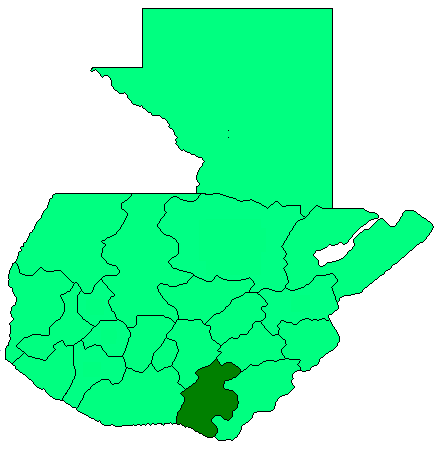
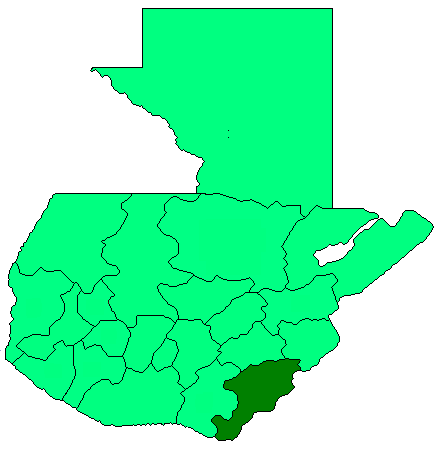
Map of Comapa
Interactive Map
Comapa Population
Years 1975 to 2020
| Data | 1975 | 1990 | 2000 | 2015 | 2020 |
|---|---|---|---|---|---|
| Population | 11,160 | 16,550 | 20,184 | 27,776 | 30,495 |
| Population Density | 76.6 / km² | 113.6 / km² | 138.6 / km² | 190.7 / km² | 209.4 / km² |
Sources: JRC (European Commission's Joint Research Centre) work on the GHS built-up grid
Comapa Population change from 2000 to 2015
Increase of 37.6% from year 2000 to 2015
| Location | Change since 1975 | Change since 1990 | Change since 2000 |
|---|---|---|---|
| Comapa | +148.9% | +67.8% | +37.6% |
| Jutiapa Department | +125.2% | +61.2% | +31.3% |
| Guatemala | +161.9% | +78.4% | +39.8% |
Sources: JRC (European Commission's Joint Research Centre) work on the GHS built-up grid
Comapa Median Age
Median Age: 18.7 years
| Location | Median Age | Median Age (Female) | Median Age (Male) |
|---|---|---|---|
| Comapa | 18.7 yrs | 19.5 yrs | 17.9 yrs |
| Jutiapa Department | 18.7 yrs | 19.5 yrs | 17.8 yrs |
| Guatemala | 18.6 yrs | 19.5 yrs | 17.8 yrs |
Sources: CIESIN (Center for International Earth Science Information Network)
Comapa Population Density
Population Density: 209 / km²
| Location | Population | Area | Density |
|---|---|---|---|
| Comapa | 30,495 | 145.6 km² | 209 / km² |
| Jutiapa Department | 470,782 | 3,305.1 km² | 142 / km² |
| Guatemala | 16.3 million | 109,009.9 km² | 149 / km² |
Sources: JRC (European Commission's Joint Research Centre) work on the GHS built-up grid
Comapa Historical and Projected Population
Estimated Population from 900 to 2100
Sources:
- JRC (European Commission's Joint Research Centre) work on the GHS built-up grid
- CIESIN (Center for International Earth Science Information Network)
- [Link] Klein Goldewijk, K., Beusen, A., Doelman, J., and Stehfest, E.: Anthropogenic land use estimates for the Holocene – HYDE 3.2, Earth Syst. Sci. Data, 9, 927–953, https://doi.org/10.5194/essd-9-927-2017, 2017.
Human Development Index (HDI)
Statistic composite index of life expectancy, education, and per capita income.
Source: [Link] Kummu, M., Taka, M. &Guillaume, J. Gridded global datasets for Gross Domestic Product and Human Development Index over 1990–2015. Sci Data 5, 180004 (2018) doi:10.1038/sdata.2018.4
Comapa CO2 Emissions
Carbon Dioxide (CO2) Emissions Per Capita in Tonnes Per Year
| Location | CO2 Emissions | CO2 Emissions Per Capita | CO2 Emissions Intensity |
|---|---|---|---|
| Comapa | 35,310 tn | 1.16 tn | 242.5 tons/km² |
| Jutiapa Department | 538,598 tn | 1.14 tn | 163 tons/km² |
| Guatemala | 17,248,451 tn | 1.06 tn | 158.2 tons/km² |
Sources: [Link] Moran, D., Kanemoto K; Jiborn, M., Wood, R., Többen, J., and Seto, K.C. (2018) Carbon footprints of 13,000 cities. Environmental Research Letters DOI: 10.1088/1748-9326/aac72a
Comapa CO2 Emissions
| 2013 CO2 emissions (tonnes/year) | 35,310 tn |
| 2013 CO2 emissions (tonnes/year) per capita | 1.16 tn |
| 2013 CO2 emissions intensity (tonnes/km²/year) | 242.5 tons/km² |
Natural Hazards Risk
Relative risk out of 10
| Hazard | Risk Level |
|---|---|
| Flood | High (9) |
| Earthquake | Medium (7) |
| Landslide | High (9) |
* Risk, particularly concerning flood or landslide, may not be for the entire area.
Sources:
- Dilley, M., R.S. Chen, U. Deichmann, A.L. Lerner-Lam, M. Arnold, J. Agwe, P. Buys, O. Kjekstad, B. Lyon, and G. Yetman. 2005. Natural Disaster Hotspots: A Global Risk Analysis. Washington, D.C.: World Bank. https://doi.org/10.1596/0-8213-5930-4.
- Center for Hazards and Risk Research - CHRR - Columbia University, Center for International Earth Science Information Network - CIESIN - Columbia University, and Norwegian Geotechnical Institute - NGI. 2005. Global Landslide Hazard Distribution. Palisades, NY: NASA Socioeconomic Data and Applications Center (SEDAC). https://doi.org/10.7927/H4P848VZ.
- Center for Hazards and Risk Research - CHRR - Columbia University, Center for International Earth Science Information Network - CIESIN - Columbia University. 2005. Global Flood Hazard Frequency and Distribution. Palisades, NY: NASA Socioeconomic Data and Applications Center (SEDAC). https://doi.org/10.7927/H4668B3D.
- Center for Hazards and Risk Research - CHRR - Columbia University, Center for International Earth Science Information Network - CIESIN - Columbia University. 2005. Global Earthquake Hazard Distribution - Peak Ground Acceleration. Palisades, NY: NASA Socioeconomic Data and Applications Center (SEDAC). https://doi.org/10.7927/H4BZ63ZS.
Recent Nearby Earthquakes
Magnitude 3.0 and greater
| Date▼ | Time↕ | Magnitude↕ | Distance↕ | Depth↕ | Location↕ | Link |
|---|---|---|---|---|---|---|
| 12/20/18 | 5:01 PM | 4.6 | 33.2 km | 165,540 m | 5km NE of San Juan Tecuaco, Guatemala | usgs.gov |
| 11/9/18 | 2:22 PM | 3.6 | 30.4 km | 10,000 m | 7km SSE of Atiquizaya, El Salvador | usgs.gov |
| 5/27/18 | 7:16 PM | 4.4 | 16.7 km | 188,830 m | 3km SE of Jutiapa, Guatemala | usgs.gov |
| 4/29/18 | 5:19 PM | 4.2 | 23.7 km | 10,000 m | 5km SE of Atescatempa, Guatemala | usgs.gov |
| 4/25/18 | 10:18 PM | 4.9 | 20.2 km | 192,890 m | 5km ENE of Quesada, Guatemala | usgs.gov |
| 1/10/18 | 3:43 PM | 4.1 | 35.4 km | 246,210 m | 11km SW of Monjas, Guatemala | usgs.gov |
| 10/9/16 | 10:55 PM | 4.8 | 31.1 km | 195,820 m | 4km N of San Jose Acatempa, Guatemala | usgs.gov |
| 8/31/16 | 4:46 AM | 4.2 | 22.8 km | 2,090 m | 5km SE of Jerez, Guatemala | usgs.gov |
| 8/29/16 | 1:05 PM | 4.6 | 29.4 km | 10,000 m | 0km NE of Candelaria de La Frontera, El Salvador | usgs.gov |
| 8/14/16 | 5:13 AM | 4.8 | 13.7 km | 139,100 m | 10km N of Tacuba, El Salvador | usgs.gov |
Source: U.S. Geological Survey (USGS)

About Our Data
The data on this page is estimated using a number of publicly available tools and resources. It is provided without warranty, and could contain inaccuracies. Use at your own risk.