Industries
Business Distribution by Industry in Comitancillo
| Industry Description | Number of Establishments |
|---|---|
| Churches | 36 |
| Education | 26 |
| Shopping | 19 |
| Car repair | 7 |
| Pharmacies and drug stores | 6 |
| Grocery stores and supermarkets | 5 |
| Electronics stores | 5 |
| Cable tv and satellite tv | 5 |
Comitancillo Facts
| Area | 113.6 km² |
| Population | 70,688 |
| Male Population | 35,249 (49.9%) |
| Female Population | 35,439 (50.1%) |
| Population change (1975 to 2020) | +227.5% |
| Population change (2000 to 2020) | +54.8% |
| Median Age | 18.6 years (Male: 17.8, Female: 19.5) |
| GDP per capita (PPP) | $3,979 (2022) |
| Neighborhoods | Zona 1 |
| Local Time | |
| Timezone | Central Standard Time |
| Lat & Lng | 15.08333, -91.71667 |
| Postal Codes | 12004 |
Map of Comitancillo
Interactive Map
Comitancillo Population
Years 1975 to 2030
| Data | 1975 | 1990 | 2000 | 2015 | 2020 | 2025* | 2030* |
|---|---|---|---|---|---|---|---|
| Population | 21,583 | 34,338 | 45,664 | 65,553 | 70,688 | 75,436 | 80,181 |
| Population Density | 189.9 / km² | 302.2 / km² | 401.9 / km² | 576.9 / km² | 622.1 / km² | 663.9 / km² | 705.7 / km² |
Comitancillo Population change from 2000 to 2020
Increase of 54.8% from year 2000 to 2020
| Location | Change since 1975 | Change since 1990 | Change since 2000 |
|---|---|---|---|
| Comitancillo | +227.5% | +105.9% | +54.8% |
| San Marcos Department | — | — | — |
| Guatemala | — | — | — |
Comitancillo Median Age
Median Age: 18.6 years
| Location | Median Age | Median Age (Female) | Median Age (Male) |
|---|---|---|---|
| Comitancillo | 18.6 yrs | 19.5 yrs | 17.8 yrs |
| San Marcos Department | 18.7 yrs | 19.5 yrs | 17.8 yrs |
| Guatemala | 18.6 yrs | 19.5 yrs | 17.8 yrs |
Comitancillo Population Density
Population Density: 622 / km²
| Location | Population | Area | Density |
|---|---|---|---|
| Comitancillo | 70,688 | 113.6 km² | 622 / km² |
| San Marcos Department | 1.1 million | 3,552.6 km² | 318 / km² |
| Guatemala | 16.3 million | 109,009.9 km² | 149 / km² |
Comitancillo Historical and Projected Population
Estimated Population from 800 to 2100
- JRC (European Commission's Joint Research Centre) work on the GHS built-up grid
- CIESIN (Center for International Earth Science Information Network)
- [Link] Klein Goldewijk, K., Beusen, A., Doelman, J., and Stehfest, E.: Anthropogenic land use estimates for the Holocene – HYDE 3.2, Earth Syst. Sci. Data, 9, 927–953, https://doi.org/10.5194/essd-9-927-2017, 2017.
Human Development Index (HDI)
Statistic composite index of life expectancy, education, and per capita income.
Comitancillo Gross Domestic Product (GDP)
GDP per capita, PPP (constant 2017 international $)
| Data | 1990 | 1995 | 2000 | 2005 | 2010 | 2015 | 2020 | 2022 |
|---|---|---|---|---|---|---|---|---|
| GDP per capita | $857 | $916 | $1,635 | $2,305 | $3,298 | $3,538 | $3,639 | $3,979 |
| Total GDP | $7M | $8.5M | $17M | $26.4M | $41.4M | $48.6M | $52.9M | $59.3M |
Comitancillo CO2 Emissions
Carbon Dioxide (CO2) Emissions Per Capita in Tonnes Per Year
| Location | CO2 Emissions | CO2 Emissions Per Capita | CO2 Emissions Intensity |
|---|---|---|---|
| Comitancillo | 77,081 tn | 1.09 tn | 678.4 tons/km² |
| San Marcos Department | 1,208,626 tn | 1.07 tn | 340.2 tons/km² |
| Guatemala | 17,248,451 tn | 1.06 tn | 158.2 tons/km² |
| 2013 CO2 emissions (tonnes/year) | 77,081 tn |
| 2013 CO2 emissions (tonnes/year) per capita | 1.09 tn |
| 2013 CO2 emissions intensity (tonnes/km²/year) | 678.4 tons/km² |
Natural Hazards Risk
Relative risk out of 10
| Hazard | Risk Level |
|---|---|
| Drought | High (10) |
| Flood | High (10) |
| Earthquake | High (8) |
| Landslide | High (10) |
* Risk, particularly concerning flood or landslide, may not be for the entire area.
- Dilley, M., R.S. Chen, U. Deichmann, A.L. Lerner-Lam, M. Arnold, J. Agwe, P. Buys, O. Kjekstad, B. Lyon, and G. Yetman. 2005. Natural Disaster Hotspots: A Global Risk Analysis. Washington, D.C.: World Bank. https://doi.org/10.1596/0-8213-5930-4.
- Center for Hazards and Risk Research - CHRR - Columbia University, Center for International Earth Science Information Network - CIESIN - Columbia University, and Norwegian Geotechnical Institute - NGI. 2005. Global Landslide Hazard Distribution. Palisades, NY: NASA Socioeconomic Data and Applications Center (SEDAC). https://doi.org/10.7927/H4P848VZ.
- Center for Hazards and Risk Research - CHRR - Columbia University, Center for International Earth Science Information Network - CIESIN - Columbia University, and International Research Institute for Climate and Society - IRI - Columbia University. 2005. Global Drought Hazard Frequency and Distribution. Palisades, NY: NASA Socioeconomic Data and Applications Center (SEDAC). https://doi.org/10.7927/H4VX0DFT.
- Center for Hazards and Risk Research - CHRR - Columbia University, Center for International Earth Science Information Network - CIESIN - Columbia University. 2005. Global Flood Hazard Frequency and Distribution. Palisades, NY: NASA Socioeconomic Data and Applications Center (SEDAC). https://doi.org/10.7927/H4668B3D.
- Center for Hazards and Risk Research - CHRR - Columbia University, Center for International Earth Science Information Network - CIESIN - Columbia University. 2005. Global Earthquake Hazard Distribution - Peak Ground Acceleration. Palisades, NY: NASA Socioeconomic Data and Applications Center (SEDAC). https://doi.org/10.7927/H4BZ63ZS.
Recent Nearby Earthquakes
Magnitude 3.0 and greater
| Date▼ | Time↕ | Magnitude↕ | Distance↕ | Depth↕ | Location↕ | Link |
|---|---|---|---|---|---|---|
| 4/29/19 | 11:48 AM | 4.3 | 36.5 km | 203,980 m | 1km WNW of Colotenango, Guatemala | usgs.gov |
| 2/27/19 | 1:53 PM | 4.5 | 29.6 km | 195,410 m | 5km SW of San Gaspar Ixchil, Guatemala | usgs.gov |
| 1/5/19 | 5:08 PM | 4.5 | 32.4 km | 148,060 m | 0km NE of San Andres Xecul, Guatemala | usgs.gov |
| 9/3/18 | 6:11 PM | 4.6 | 18.2 km | 179,110 m | 8km ESE of Huitan, Guatemala | usgs.gov |
| 3/11/18 | 12:24 PM | 4.3 | 38.8 km | 89,080 m | 5km SE of Nuevo Progreso, Guatemala | usgs.gov |
| 11/19/17 | 11:10 AM | 4.2 | 25.8 km | 171,430 m | 3km NE of Concepcion Tutuapa, Guatemala | usgs.gov |
| 6/14/17 | 7:29 AM | 6.9 | 36.9 km | 93,000 m | 2km SSW of San Pablo, Guatemala | usgs.gov |
| 1/9/17 | 10:27 AM | 4.6 | 26 km | 190,730 m | 4km WNW of Concepcion Tutuapa, Guatemala | usgs.gov |
| 8/18/16 | 7:41 AM | 4.3 | 19.1 km | 184,260 m | 6km SSW of Concepcion Tutuapa, Guatemala | usgs.gov |
| 10/13/15 | 7:19 AM | 4.2 | 30.5 km | 10,000 m | 6km NE of San Jose Ojetenan, Guatemala | usgs.gov |
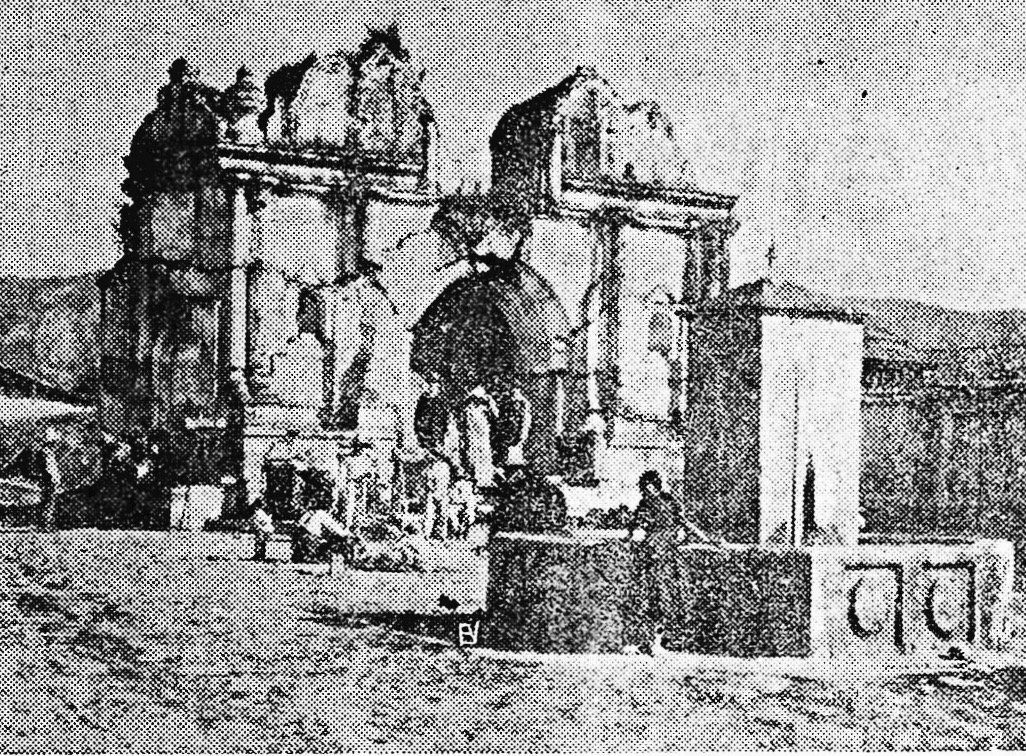
Comitancillo
Comitancillo is a municipality in the San Marcos department of Guatemala.The spoken language is Mam.The municipality was founded by the Spaniards between 1633 and 1648 year. There is an archaeological site called Chipel, with remains of the Mam cultu..
Comitancillo Wikipedia Page


About Our Data
The data on this page is estimated using a number of publicly available tools and resources. It is provided without warranty, and could contain inaccuracies. Use at your own risk.